
What is a bar chart?
Bar charts are a method of displaying data where the height of the bar tells you how much each category is worth.
The significant points on a bar graph.
There are four things that a examiner will look for when a bar graph is drawn:
1) The width of each bar must be the same.
2) There must be a gap between each bar and it must be the same size gap each time.
3) With the scales - frequency (how often something occurs) must go up the side, and the other category along the bottom. The categories for the bottom scale must be written under the middle of each bar.
4) Each axis must have a label.
Example:
The scores for a class in a maths test are shown below:
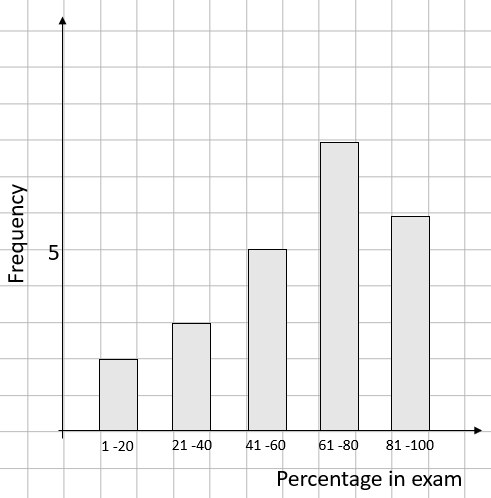
How many pupils are in the class?
All we have to do for this one is work out what each bar on the chart is worth. This is given by reading off the height on the side.
2 + 3 + 5 + 8 + 6 = 24
Let's move on to some questions now.

Teacher explanation