In this worksheet, we will learn about plotting points
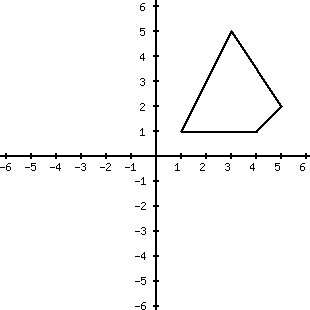
Remember that the x-coordinate comes before the y-coordinate.
The coordinates of the corners of the shape above are (1, 1), (4, 1), (5, 2), (3, 5).

In this worksheet, students plot and read points and understand the simple reflection of points in the x- and y-axes.
Key stage: KS 2
Year: Year 5 11+ worksheets
Curriculum topic: Maths and Numerical Reasoning
Curriculum subtopic: Interpreting Data
Difficulty level: 

---- OR ---- Preview Activity
We're here to help your child succeed. Track progress, measure results and access thousands of online tutorial worksheets in Maths, English and Science with an EdPlace subscription.
We're your National Curriculum aligned online education content provider helping each child succeed in English, maths and science from year 1 to GCSE. With an EdPlace account you’ll be able to track and measure progress, helping each child achieve their best. We build confidence and attainment by personalising each child’s learning at a level that suits them.
Get started
Try an activity or get started for free


