

How tall are you?

The following frequency chart shows the heights of children in a Year 8 class at the EdPlace school.
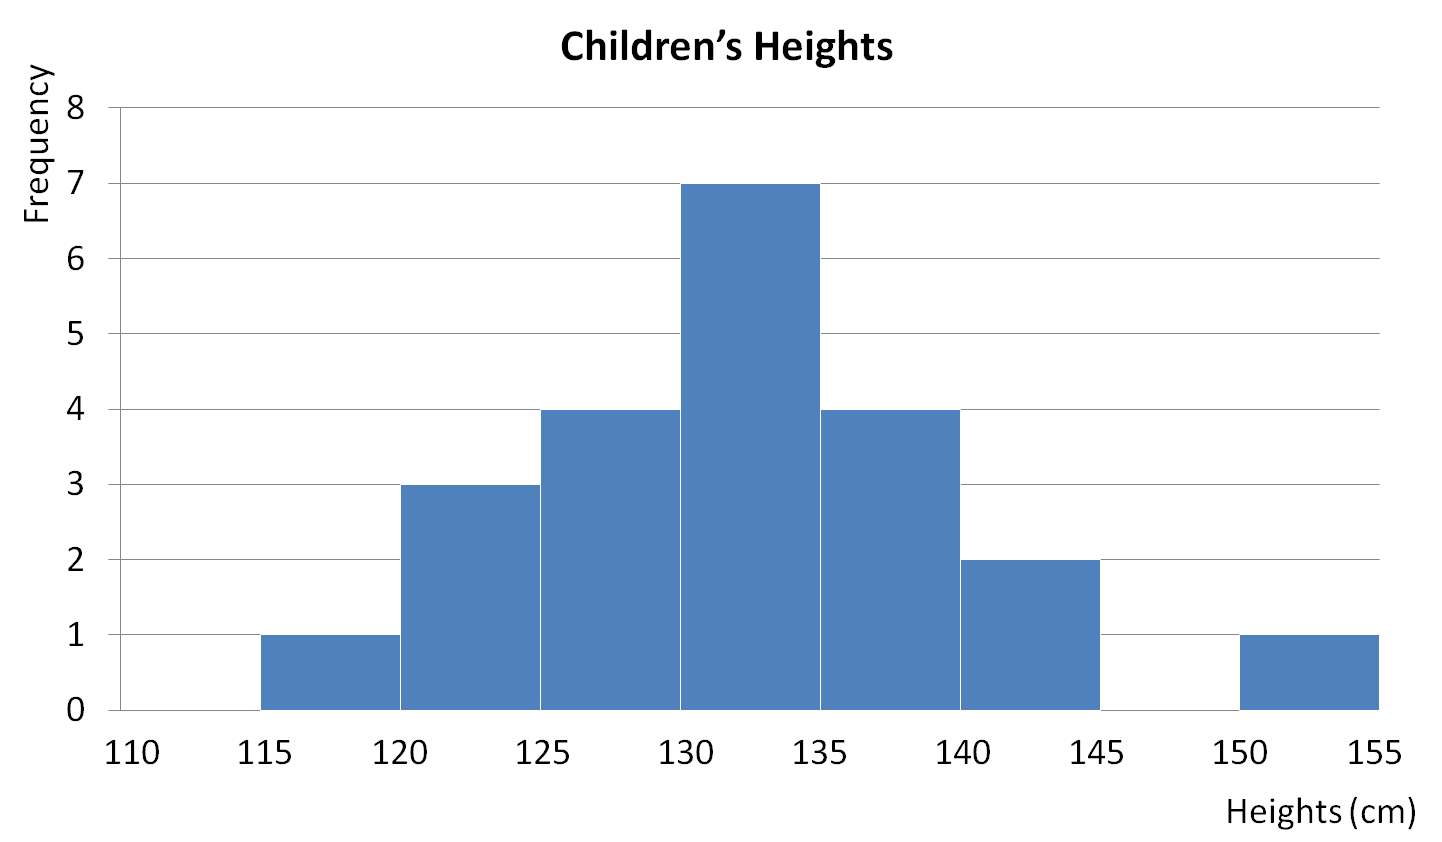
Let's remember that frequency is just 'how many times' something occurs and when data is grouped (like in this chart!), the exact value is not known.
For example, here we have:
0 children have a height between 110 cm and 115 cm.
1 child has a height between 115 cm and 120 cm.
3 children have a height between 120 cm and 125 cm ..... etc.
We can use a frequency chart to work out our three averages: mean, median and mode!
Mean
We can only estimate the mean by using the midpoint value in each class.
These are 112.5, 117.5, 122.5, 127.5, 132.5, 137.5, 142.5, 147.5 and 152.5 cm
We multiply these midpoint values by the frequency that they occur. eg. 3 x 122.5 because three children are in that height group.
The estimated sum of all the heights is:
(1 x 117.5) + (3 x 122.5) + (4 x 127.5) + (7 x 132.5) + (4 x 137.5) + (2 x 142.5) + (1 x 152.5) = 2,910 cm
We add all the frequencies to find the number of children in the class:
1 + 3 + 4 + 7 + 4 + 2 + 1 = 22 children in total
The estimate for the mean height is therefore:
2,910 ÷ 22 = 132.3 cm (1 dp)

Median
We have found that there are 22 children in total.
So the 'middle person' will be the (22 + 1) ÷ 2 = 11.5th person, i.e. the value between the height of the 11th and 12th person.
The 11th and 12th people both fall into the 130 cm to 135 cm class.
So the median class is 130 cm to 135 cm.
Mode
This is the class with the highest frequency.
We can see that the tallest bar (i.e. the one with the highest frequency) is the one for 130 to 135 cm.
So the modal class is 130 cm to 135 cm.
Easy!
That's a lot of information to take in - don't worry if you can't remember it all, you can check back to this introduction at any point during the activity by clicking on the red button on the side of the screen!
Grab your calculator and let's get started!
.jpg)


