
Tree diagrams are useful to answer probability questions where there is more than one event happening in succession.
Look at this example, which shows the probability that my bus is on time or late on Monday and Tuesday.
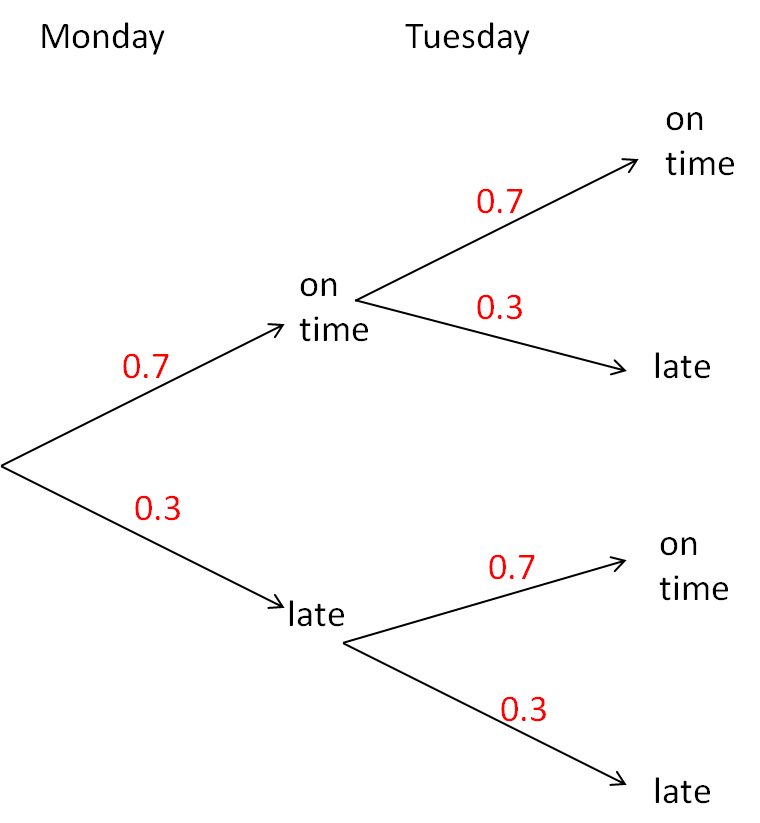
The probability that it is on time on any day is 0.7 and the probability that it is late is 0.3.
To work out the probability that it will be late on Monday and on Tuesday, we travel down the relevant route and multiply the probabilities together.
P(late on two days) = 0.3 x 0.3 = 0.09
Example
There are 8 red balls and 2 yellow balls in Bag 1.
There are 4 red balls and 6 yellow balls in Bag 2.
I take one ball from Bag 1 and then one ball from Bag 2.
What is the probability of choosing two red balls.
Give your answer as a reduced fraction.
Answer
Here is a tree diagram to show this information.
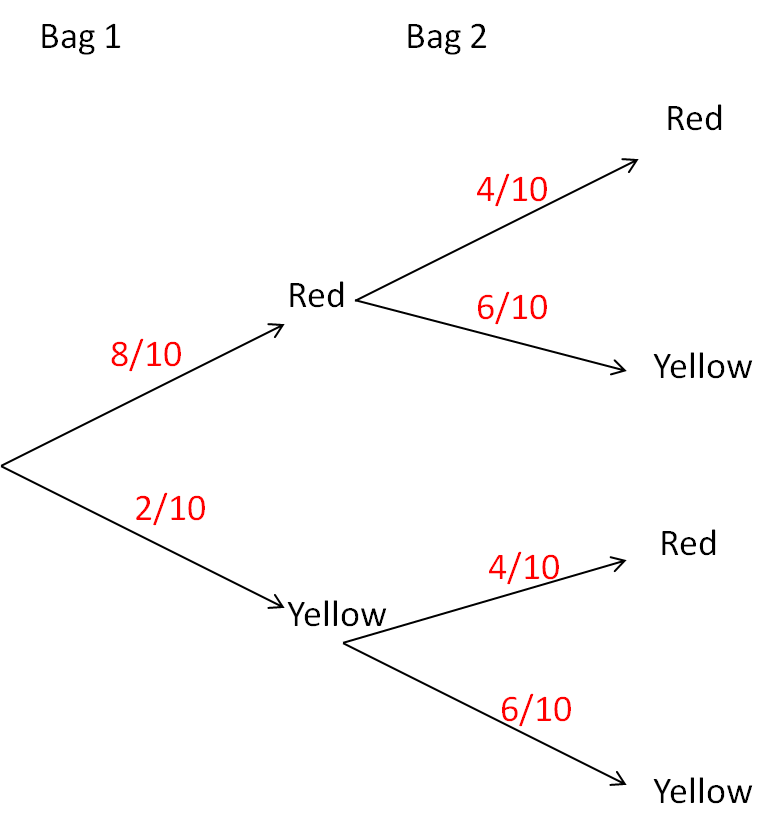
P(Red Red) = 8/10 x 4/10 = 32/100 = 8/25
Let's try some questions now.

Teacher explanation