
Pie charts are based on fractions of 360°
The fractions can be worked out from the angles at the centre of the chart.
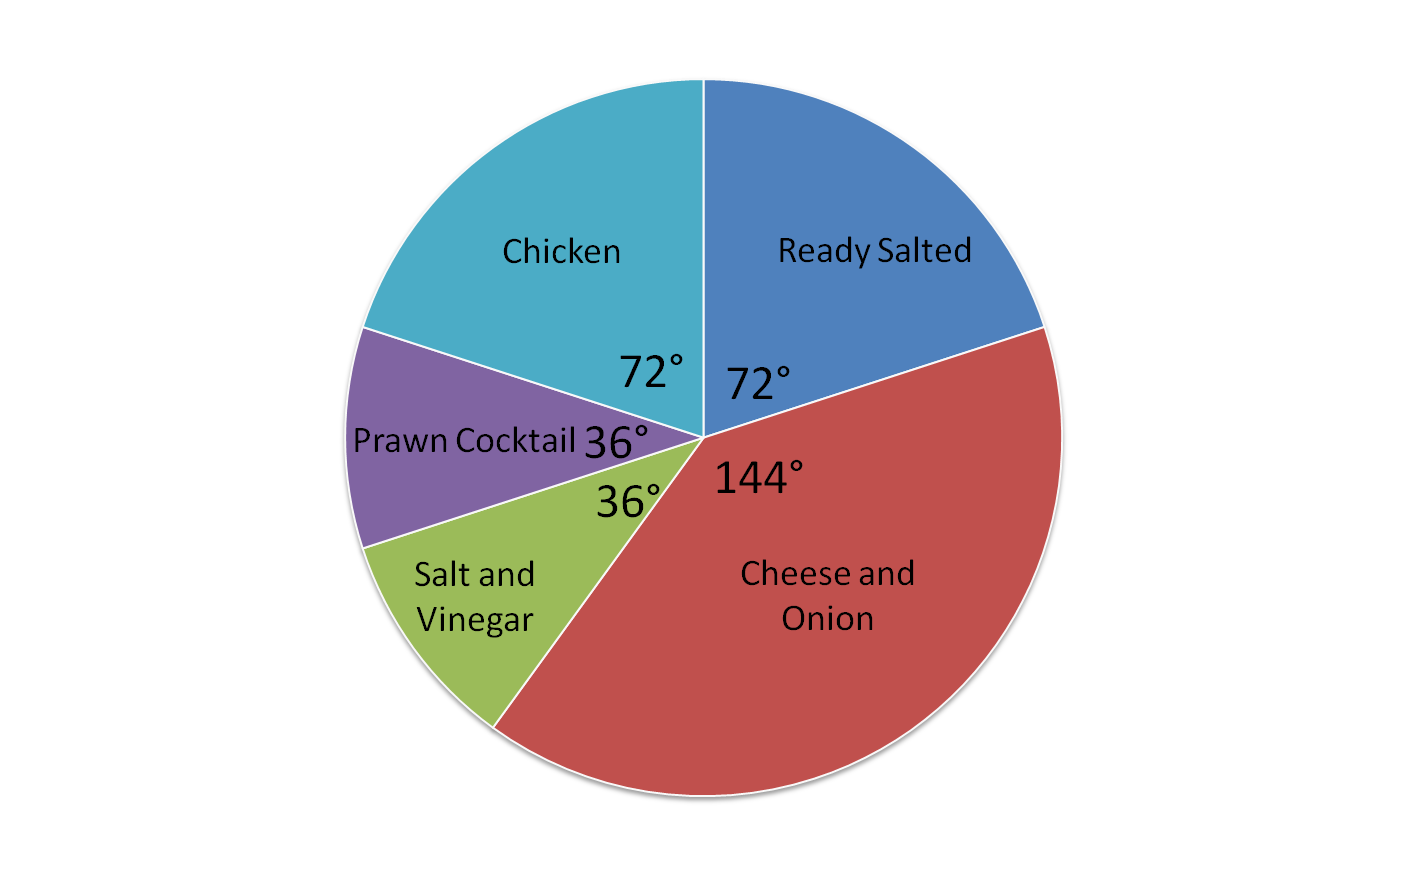
This pie chart shows the results of a survey on favourite crisp flavours.
The salt and vinegar sector shows 36° which is 36/360 of the whole circle.
We can simplify this by dividing both the top and bottom by 36 to get the fraction 1/10
Now we need a hard fact, such as the actual number who chose salt and vinegar or the total number in the survey.
Example 1
If 15 people chose salt and vinegar, how many people took part in the survey?
Answer
15 people are shown in 1/10 of the circle, so there must be 10 x 15 = 150 people in total.

Example 2
If 40 people took the survey, how many people chose salt and vinegar?
Answer
We need to work out 1/10 of 40 = 4, so 4 people chose salt and vinegar.
Shall we try some questions now - if you're not too hungry!

Teacher explanation