
In this activity, we will be answering questions based on the information shown in bar charts.
A survey is carried out at school, in which children are asked to say which pets they own.
The results are shown in this bar chart.
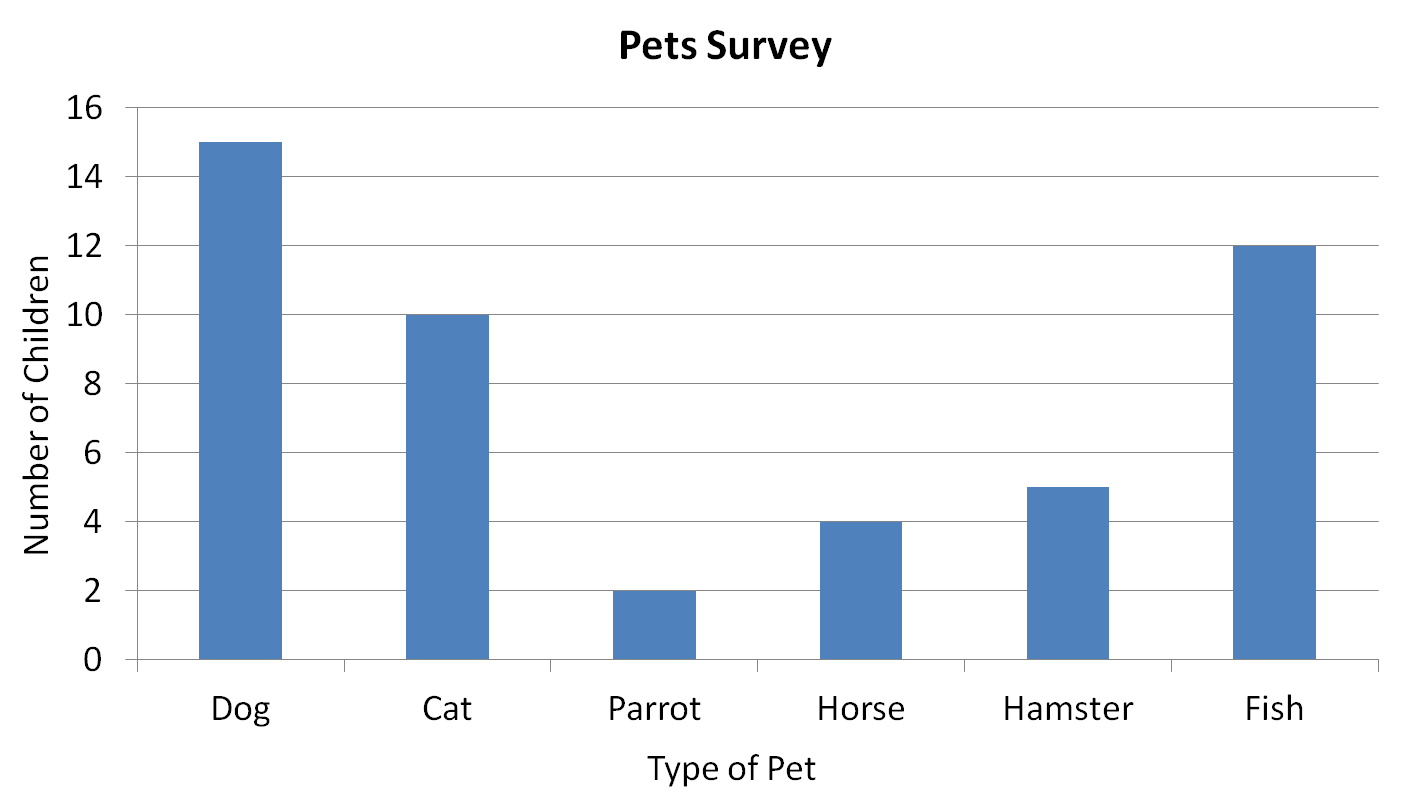
We can see from this that 15 children have dogs, as the bar labelled dog reaches halfway between the 14 and the 16 on the y-axis.
We can also see that parrots are the least popular pet.
Let's try an example question together.
Example
How many children like either parrots or horses?

Answer
First, find the number of votes for parrots.
Parrot has 2 votes.
Next, find the number of votes for horses.
Horse has 4 votes.
Lastly, add these two numbers together.
4 + 2 = 6
There were 6 votes for parrots and horses.
Now we've had a look at a bar chart, you are ready to try some questions for yourself.

Teacher explanation