
x
Introduction
In this activity, we'll look at how to use a bar chart to complete a table.
Example:
The table and the bar chart show the marks gained by a class in a maths test.
Use the data in the bar chart to complete the data in the table.
Chart:
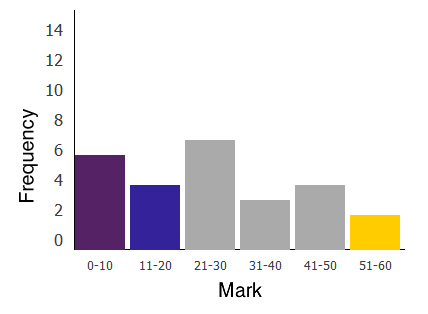
Table:
| Mark | Frequency | ||
|
|
||
|
|
||
|
|
||
|
|
||
|
|
||
|
|
Find A, B, C.
How many children took the test?
Answers:
A = 6
B = 4
C = 2
Number of children who took the test = 6 + 4 + 7 + 3 + 4 + 2 = 26
In the following questions, we will be looking at loads of bar charts to give you plenty of practice at this important skill.
So, what are we waiting for?!

Preview only, get started for free to complete this activity

Teacher explanation