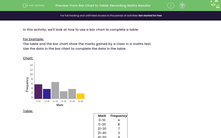


In this activity, we'll look at how to use a bar chart to complete a table.
Example:
The table and the bar chart show the marks gained by a class in a maths test.
Use the data in the bar chart to complete the data in the table.
Chart:
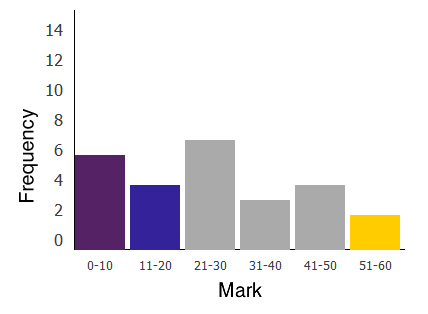
Table:
| Mark | Frequency | ||
|
|
||
|
|
||
|
|
||
|
|
||
|
|
||
|
|
Find A, B, C.
How many children took the test?
Answers:
A = 6
B = 4
C = 2
Number of children who took the test = 6 + 4 + 7 + 3 + 4 + 2 = 26
In the following questions, we will be looking at loads of bar charts to give you plenty of practice at this important skill.
So, what are we waiting for?!