Loading please wait

The smart way to improve grades

Comprehensive & curriculum aligned

Try an activity or get started for free

Find the Mean from Tables of Data

In this worksheet, students will calculate the mean of a given set of data from a table.

'Find the Mean from Tables of Data' worksheet

Key stage:  KS 2

Year:  Year 6 Maths worksheets

Curriculum topic:   Statistics

Curriculum subtopic:   Calculate Average/Interpret Mean

Difficulty level:  

Worksheet Overview

There are several different types of averages.

An average is one number that represents a set of numbers.


The mean is a number that we calculate by adding up all the numbers in the set and dividing this total by how many numbers there are.


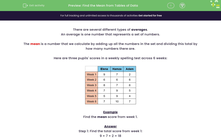
Here are three pupils' scores in a weekly spelling test across 6 weeks:


data for finding the mean


Example

Find the mean score from week 1.


Answer

Step 1: Find the total score from week 1:

9 + 7 + 2 = 18


Step 2: Now divide the total by how many numbers there are in the set, which is 3: 

18 ÷ 3 = 6


The mean score from week 1 is 6


Easy, right? 


boy thinking


Let's have a go at some questions then!

What is EdPlace?

We're your National Curriculum aligned online education content provider helping each child succeed in English, maths and science from year 1 to GCSE. With an EdPlace account you’ll be able to track and measure progress, helping each child achieve their best. We build confidence and attainment by personalising each child’s learning at a level that suits them.

Get started
laptop

Try an activity or get started for free

  • National Tutoring Awards 2023 Shortlisted / Parents
    National Tutoring Awards 2023 Shortlisted
  • Private-Tutoring-WINNER-EducationInvestor-Awards / Parents
    Winner - Private Tutoring
  • Bett Awards Finalist / Parents
    Finalist
  • Winner - Best for Home Learning / Parents
    Winner - Best for Home Learning / Parents