Loading please wait

The smart way to improve grades

Comprehensive & curriculum aligned

Try an activity or get started for free

Interpret a Travel Graph

In this worksheet, students will answer questions about data on a line graph.

'Interpret a Travel Graph' worksheet

Key stage:  KS 2

Year:  Year 6 Maths worksheets

Curriculum topic:   Statistics

Curriculum subtopic:   Use Charts and Graphs

Difficulty level:  

Worksheet Overview

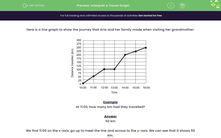
Here is a line graph to show the journey that Aria and her family made when visiting her grandmother:


distance-time graph


Example

At 11:00, how many km had they travelled?


Answer

50 km


We find 11:00 on the x-axis, go up to meet the line and across to the y-axis. We can see that it shows 50 km.

This is how far away from home they have travelled.


grandmother reading to children


Let's get started and have a go at answering some more questions about this line graph.

What is EdPlace?

We're your National Curriculum aligned online education content provider helping each child succeed in English, maths and science from year 1 to GCSE. With an EdPlace account you’ll be able to track and measure progress, helping each child achieve their best. We build confidence and attainment by personalising each child’s learning at a level that suits them.

Get started
laptop

Try an activity or get started for free

  • National Tutoring Awards 2023 Shortlisted / Parents
    National Tutoring Awards 2023 Shortlisted
  • Private-Tutoring-WINNER-EducationInvestor-Awards / Parents
    Winner - Private Tutoring
  • Bett Awards Finalist / Parents
    Finalist
  • Winner - Best for Home Learning / Parents
    Winner - Best for Home Learning / Parents