Are you looking for fun learning activities for half term? Don't look further! Our Maths teachers collected some tips and ideas to bring Maths into everyday activities. Here is the second part with activities for year 7-11 students. Keep your children entertained while boosting their creative learning with these fun ideas.
Year 7-9 - Randomly Constructing Shapes
Instructions: Randomly choose 3 numbers between 1 and 10. Don’t just think of them –
they wouldn’t be random! Use a die, a pack of cards, an app or any other random method you can think of.
Grab a ruler and a pair of compasses and construct a triangle using your three random numbers as side lengths. (Please see the animation on how to draw a triangle given three sides here)
- How many different triangles could you draw using those side lengths?
- Do you think that different random numbers might let you construct more or fewer triangles? How can you tell?
- Are there any numbers that wouldn’t let you construct any triangles at all?
Now randomly generate 4 numbers and draw a quadrilateral using these side lengths. Think about how you constructed the triangle and apply that thinking.
- How many different quadrilaterals could you draw?
- Do you think that different random numbers might let you construct more or fewer quadrilaterals? How can you tell?
- Are there any numbers that wouldn’t let you construct any quadrilaterals at all?
- What other great shapes or constructions could you make with just a pair of compasses and a ruler?
Have you tried our Maths Assessment yet? Join EdPlace’s Maths Challenge: work through the questions, complete the recommended online worksheets and earn badges! Have fun!
Year 10 & 11 - Computer Virus
There is a horrible computer virus that has infected 1/6 of the world’s computers…
You can no longer connect to the internet until your computer has been checked. Let’s imagine that a new test has come out that detects the virus quite accurately but can also falsely show that clean computers have been infected.Let’s make a few assumptions:
- 1/6 of the computers are infected.
- 11/12 of the infected computers give a positive result to this new test.
- ⅛ of the uninfected computers give a positive result to this new test.
Conduct an experiment using these probabilities. You could use cards, dice, coins or a random number generator to simulate these probabilities to decide two things.
- Are they infected or uninfected computers?
- Do they give a positive or negative test?
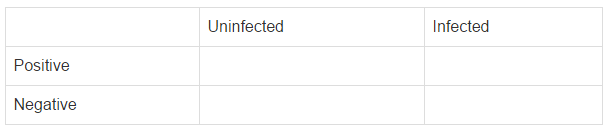
Do this experiment 50 times and fill in this two way table with tallies
- Are you surprised by the results?
- If so, do you need to experiment some more?
- According to your experiment, what are the probabilities for the four different outcomes?
- If a computer tests positive for infection, do you think it’s infected?
Now draw a tree diagram using the original probabilities. This is called theoretical probability
- Does it give the same results as your experiment? Should it? If not, why not?
- How does reducing the percentage of infected computers affect the results?
- Would you try to connect to the internet before being checked?
Read the first part here with activities for year 1-6 students.