

In this activity, we will be looking at direct proportion when it is presented in a table.
We have seen this before when we are creating coordinates to draw graphs.
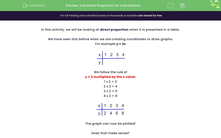
For example y = 2x

We follow the rule of
y = 2 multiplied by the x value:
1 x 2 = 2
2 x 2 = 4
3 x 2 = 6
4 x 2 = 8

The graph can now be plotted!
Does that make sense?

Great!
Now, how about if we have to find the rule?!
Confused? Let's have a look at an example to help!
Example
y is directly proportional to x
Complete the table below:

Answer
We need to look at the table to see where we have the x and the y values.
We can use these to find the rule.
We have x = 5 when y = 20
To find the multiplier, we can do 20 ÷ 5 = 4
So, we can see that y = 4x
or
the y values are 4 times bigger than the x values.
We can now fill in the gaps:
When x = 3, then y = 4 x 3 = 12
When x = 8, then y = 4 x 8 = 32

Let's try some more of these!