


Did you know that differences between organisms are known as variation?
Of course, there's a lot of variation between different types of animals (take a goldfish and an elephant, for example!).
Organisms that share common characteristics belong to the same species, but there is variation even between organisms of the same species.
Organisms of the same species can reproduce with one another and produce offspring that can also reproduce.
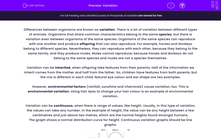
Horses and donkeys belong to different species. Nevertheless, although they can reproduce with each other (because they belong to the same horsey family) they produce mules, and mules cannot reproduce because horses and donkeys do not belong to the same species and mules are not a species themselves. OK?
.jpg)
Variation can be inherited, when youngsters take features from their parents.
Half of the information we inherit comes from our mother and half from our father.
So, children have features from both parents, but the mix is different in each child. Natural eye colour and ear shape are two examples of those sorts of features.

However, environmental factors (for example rainfall, sunshine and pollution) cause variation, too. This is environmental variation.
Using hair dyes to change your hair colour is an example of environmental variation, as is any accidental injury.

That's not all! Variation can be continuous, when there is range of values, like the height of students in your class.
Usually, in this type of variation, the values can take any number. In the example of height, the value can be any height between a few centimetres and just above two metres, which are the normal heights found amongst humans.
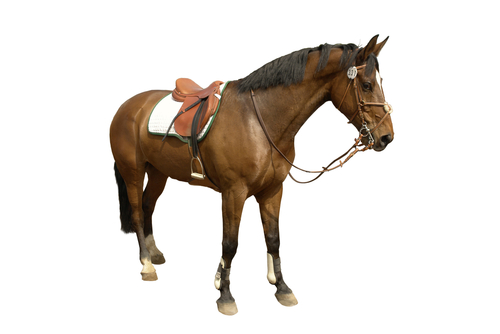
The graph shows a normal distribution curve for height:

In this graph, most students' heights fall in the middle, with just a few really short or really tall people at either end of the graph. Does that make sense?
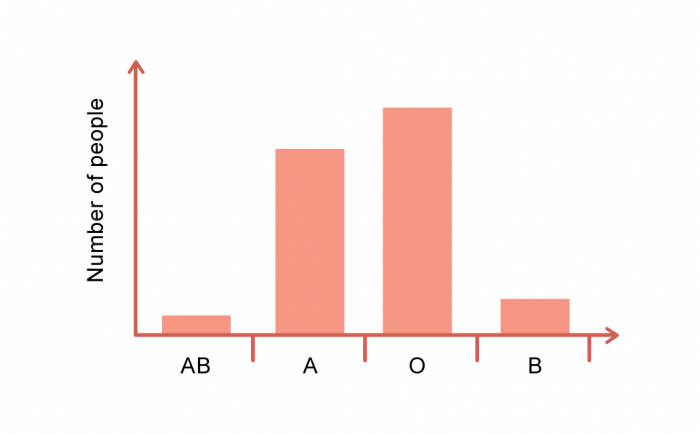
When there is not a continuous range of values, such as blood type or eye colour, the variation is discontinuous.
Discontinuous variation values are plotted on a bar graph:
So, are you ready for some questions?


