


Properties of a wave
Imagine two people shaking a rope up and down as shown in the diagram:
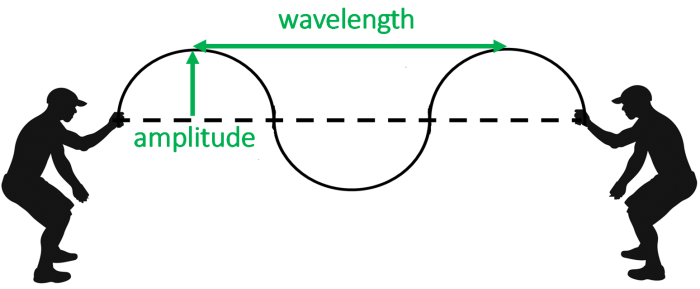
Notice the dotted horizontal line represents the equilibrium position of the wave. (This is where the rope would be if there was no wave being produced). The highest points of the wave are called peaks (or 'crests') and the lowest points are called troughs.
Two properties of the wave have been labelled. The amplitude is the maximum displacement from equilibrium. You can think of it as the 'height' of the wave. It must be measured vertically from the central resting position, not from the peak to the trough.
The wavelength is literally the length of one wave. It can be easily found by measuring the distance between two peaks.
Amplitude and wavelength are both measurements of distance, so their units are both metres.
Frequency and Time Period
Frequency is the number of waves in one second and it has the unit Hertz (Hz). For example, if the people in the diagram made 3 waves every second, the frequency would be 3 Hz. More frequency would mean more waves every second, meaning the wave would become more 'squashed'.
The time period of a wave is the time taken for one complete wave. This is measured in seconds (s). Frequency and time period are inverse - this means that if one is multiplied by a certain amount, the other one must divide by the same amount. (For example, if you double the frequency, the time period would halve).
Calculating these properties
Sometimes, you may be given a wave diagram that includes more than one wave. In such cases, it isn't so straightforward to look at the numbers and work out amplitudes and wavelengths.
Let's look at an example:
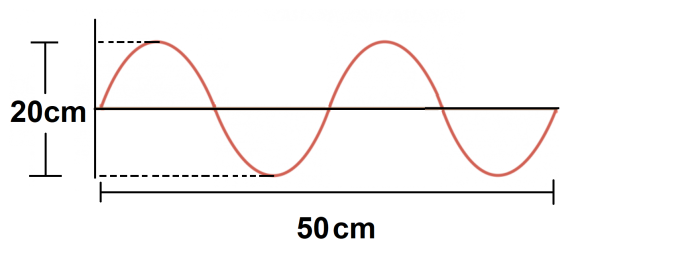
It would be tempting to say that the amplitude is 20 cm and the wavelength is 50 cm, but this would be incorrect. This is the because the height labelled is from the peak to the trough, and the horizontal distance shows two waves instead of just one wave.
Remember, the amplitude is only measured from equilibrium to the peak, and so this would be half of the total height. Therefore, the amplitude of this wave is 10 cm.
Meanwhile, to work out the wavelength, the easiest thing to do is divide the total distance by the number of waves. In this case, the total distance is 50 cm and you have two complete waves.
So, the wavelength is 50 cm ÷ 2 waves = 25 cm
One final point to note: If the x-axis of the diagram is given in seconds instead of metres, then the distance between peaks will tell you the time period, and not the wavelength.

Shall we try some questions?


