Loading please wait

The smart way to improve grades

Comprehensive & curriculum aligned

Try an activity or get started for free

Studying Line Graphs: How Long is the Journey?

In this worksheet, students read a line graph about journey times and lengths then answer questions on it.

This content is premium and exclusive to EdPlace subscribers.

'Studying Line Graphs: How Long is the Journey?' worksheet

Key stage:  KS 2

Year:  Year 4 11+ worksheets

Curriculum topic:   Maths and Numerical Reasoning

Curriculum subtopic:   Interpreting Data

Difficulty level:  

Worksheet Overview

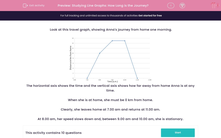
 Look at this travel graph, showing Anna's journey from home one morning.


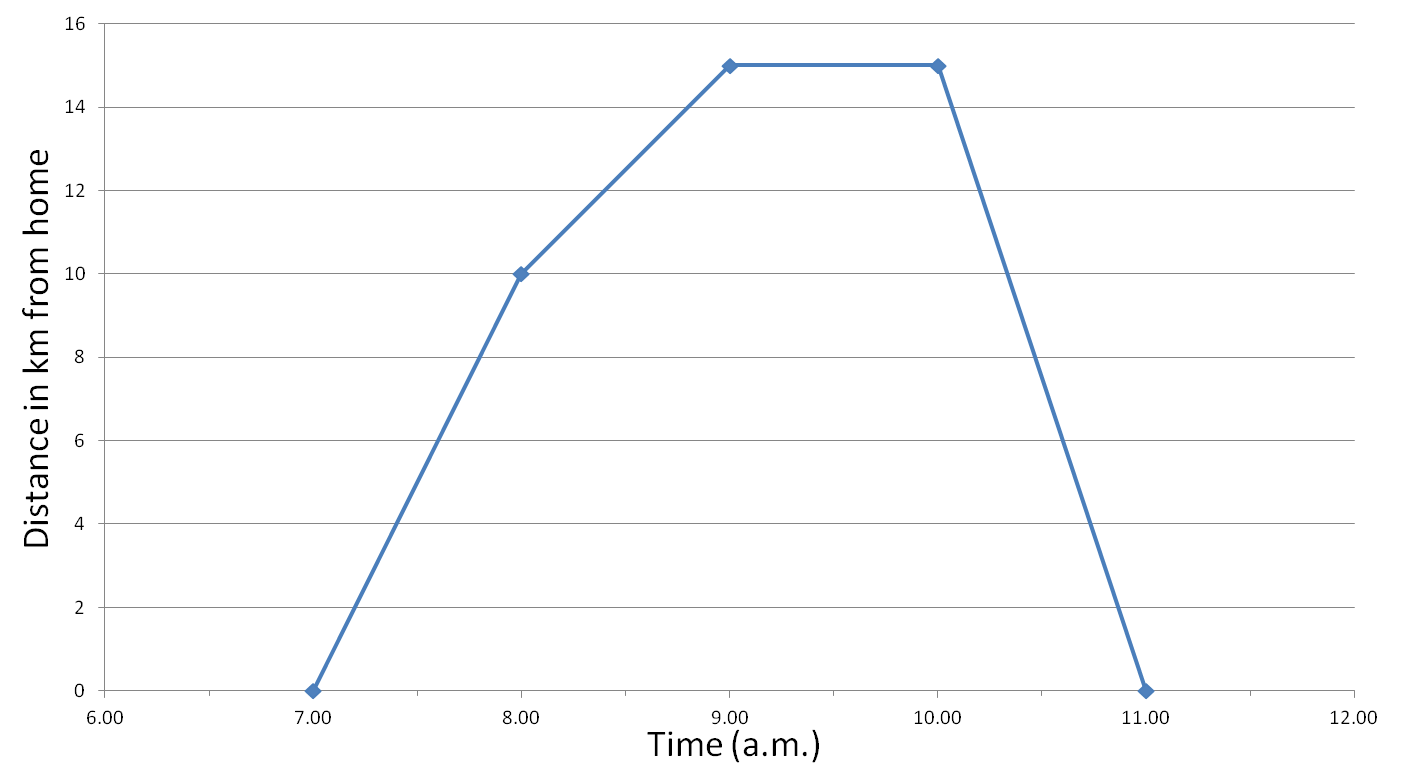
The horizontal axis shows the time and the vertical axis shows how far away from home Anna is at any time.


When she is at home, she must be 0 km from home.


Clearly, she leaves home at 7.00 am and returns at 11.00 am.


At 8.00 am, her speed slows down and, between 9.00 am and 10.00 am, she is stationary.

What is EdPlace?

We're your National Curriculum aligned online education content provider helping each child succeed in English, maths and science from year 1 to GCSE. With an EdPlace account you’ll be able to track and measure progress, helping each child achieve their best. We build confidence and attainment by personalising each child’s learning at a level that suits them.

Get started
laptop

Try an activity or get started for free