
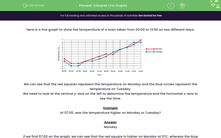


Here is a line graph to show the temperature of a town taken from 02:00 to 13:00 on two different days:

We can see that the red squares represent the temperature on Monday and the blue circles represent the temperature on Tuesday.
We need to look at the vertical y-axis on the left to determine the temperature and the horizontal x-axis to see the time.
Example
At 07:00, was the temperature higher on Monday or Tuesday?
Answer
Monday
If we find 07:00 on the graph, we can see that the red square is higher on Monday at 0°C, whereas the blue circle is lower at -1°C.

Let's get started and have a go at answering some more questions about this line graph.


