

Data can be represented in lots of different ways.
One way is with a pie chart.
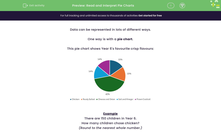
This pie chart shows Year 6's favourite crisp flavours:

Example
There are 150 children in Year 6.
How many children chose chicken?
(Round to the nearest whole number.)
Answer
We can see from the pie chart that 15% of the children chose chicken.
We know there are 150 Year 6s in total.
We need to find 15% of 150.
We can do this in several ways.
Here are two methods:
Method 1: Find 1% and multiply by 15
1%: 150 ÷ 100 = 1.5
1.5 x 15 = 22.5
Method 2: Find 10% and 5% and add together
10%: 150 ÷ 10 = 15
5%: 15 ÷ 2 = 7.5
15 + 7.5 = 22.5
Both methods give you the same answer.
I know what you're thinking - how can you have 22.5 children?!
It's just because the percentages have been rounded, so that's why the question told us to round to the nearest whole number:
22.5 rounded to the nearest whole number is 23.
The answer is 23.

Now let's have a go at some more questions together.


