


Listing all possible outcomes of one event, such as rolling a die, is straightforward - we've got 1, 2, 3, 4, 5 and 6.
But what would be a neat way to list all possible outcomes of combined events (such as flipping a coin and rolling a die)?
We could use a table!
For example, for the combined events of flipping a coin and rolling a die, we have:
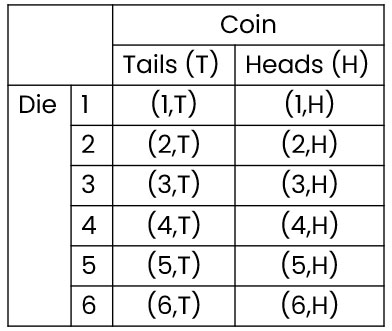
We can then use this to calculate probabilities for these combined events!
For example, if we wanted the probability of getting a multiple of 3, we can then see there are four possible outcomes: two in the row for 3 and two in the row for 6.
In particular, we have: (3,T), (3,H), (6,T), (6,H)
(Notice we just want a multiple of 3 - we don't care what the coin gives as there was no mention of it in the probability we want to find!)
We can then either count up all the outcomes or multiply 6 (the number of possible outcomes for the die) with 2 (the number of possible outcomes for the coin) to get 12 possible outcomes in total.
So the probability of getting a multiple of 3 when rolling a die and flipping a coin is 4/12 = 1/3

For some questions (even including the one we've just done!), it's not necessary to draw the table.
For example, if we were flipping a coin and rolling a die and were asked the probability of getting tails and an even number, we might just list the desired outcomes:
(2,T), (4,T), (6,T)
So three desired outcomes.
We know there are 2 x 6 = 12 outcomes in total.
So the probability required is 3/12 = 1/4.
But for more complicated scenarios, a table might be necessary!
Let's say we are rolling two die and then recording the sum of the two numbers.
The table would then look like this:
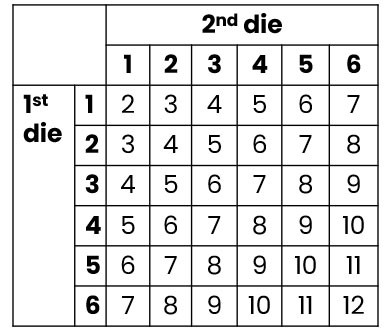
How could we find the probability of getting the sum of 9?
We can see that 9 appears in the table four times.
Altogether, we have 6 x 6 = 36 possible outcomes.
So the probability of getting the sum of 9 when rolling two dice is 4/36 = 1/9!
Doesn't having the table make it much easier?

By creating the table (or listing all the possible outcomes in any other way), we've generated the sample space.
The sample space is simply what we call the set of all possible outcomes!
Ready to put all this into practice?


