

Do you play any sports?

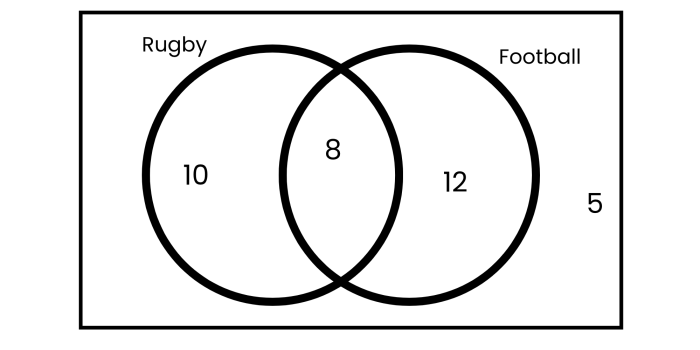
Year 7 students at the EdPlace school were asked if they played rugby or football.
The results were organised using a Venn diagram:
Let's say we now pick a student from Year 7 at random.
What is the probability they play both sports?
Well, we can see there are 8 students where the two circles overlap, i.e. in the intersection.
That means that 8 students play both sports!
How could we find out how many students there are in Year 7 in total?
That's right, we just add all the numbers in the Venn diagram together!
There are 10 + 8 +12 + 5 = 35 students in Year 7.
We've found that there are 8 out of 35 Year 7 students that play both sports.
That means that the probability that a Year 7 student selected at random plays both sports is 8/35

Can you have a guess how we'd find the probability that a Year 7 student selected at random plays neither sport?
We can see that there are 5 students that are in neither circle, i.e. 5 students who play neither sport.
There are still 35 students in total.
So the probability that a Year 7 student plays neither is:
5/35 = 1/7
.jpg)
Let's have a look at more examples!
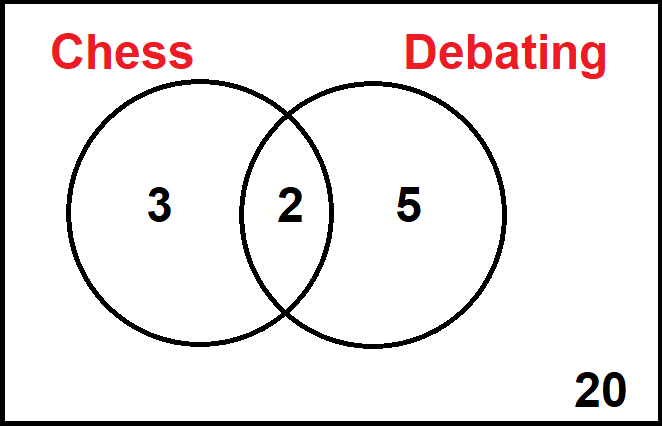
Year 7 students were asked what after-school club they go to: chess or debating.
The results are illustrated in the following Venn diagram:
What is the probability that a student picked at random goes to chess or debating?
First things first!
In maths, when we say 'or', we don't mean 'either ... or ...' we mean '... or ... or both'.
That means that when we want students who go to chess or debating, we want those who go only to chess, only to debate or to both.
So for example here, we want all the numbers in the circles added together:
3 + 2 + 5 = 10 students go to chess or debating.
We call this the union.
To get how many Year 7 students there are altogether, we simply add all the numbers in the diagram together:
3 + 2 + 5 + 20 = 30
So 10 out of 30 students go to chess or debating.
That means the probability that a student picked at random goes to chess or debating is:
10/30 = 1/3
Let's have a go at some questions!


