Using tables, charts and diagrams to find probability is an important skill that you will become more and more familiar with through your maths journey.
In this activity, we will be looking at data in:
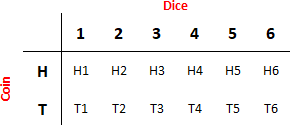
Sample space diagrams:
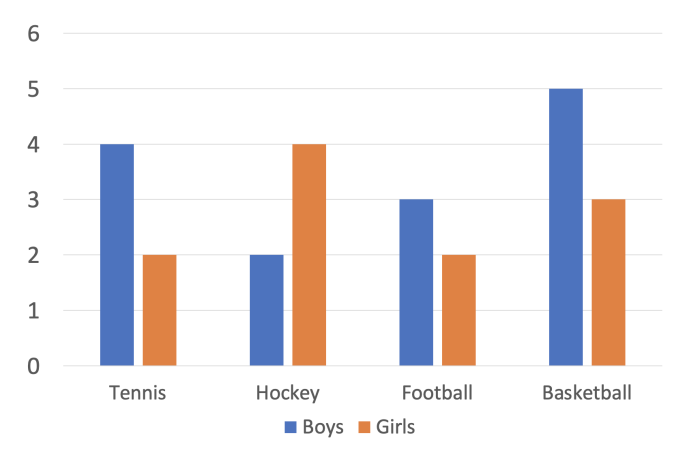
Bar charts:
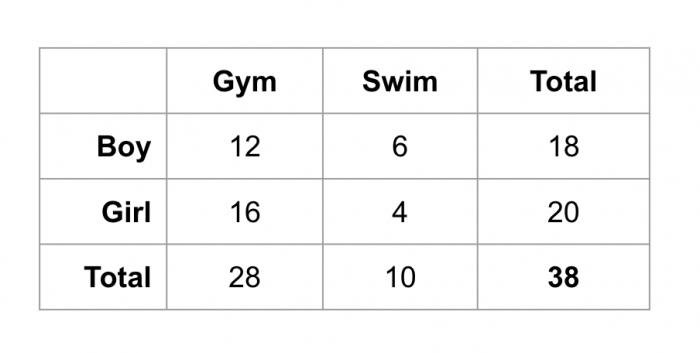
Two way tables:
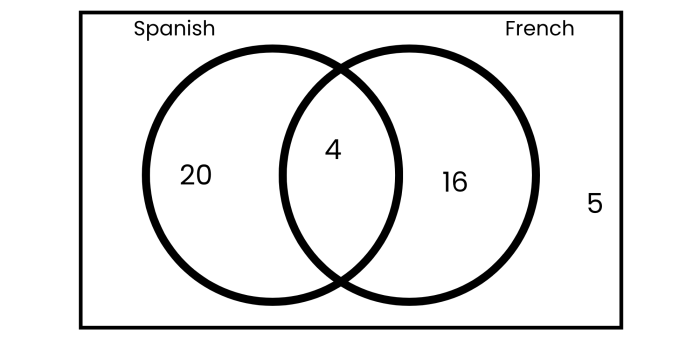
Venn diagrams:
Tally charts:
.png)
In all of the questions in this activity, remember the rules of writing probability as a fraction.
The numerator (top number in the fraction) is the outcome you have been asked to find
The denominator (bottom number in the fraction) is the total number of outcomes
Look carefully at the data!

Let's go!

