

How tall are you?

There are two Year 9 classes at the EdPlace school: class A and class B.
The heights of the students in both classes were measured and the following box plots were created:
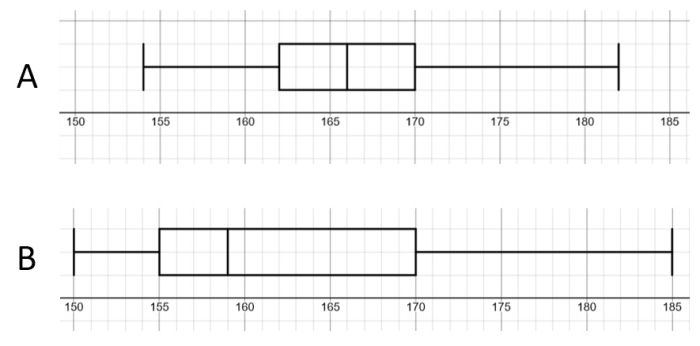
What could we conclude about the height distributions of the two classes?
There are quite a few differences so let's unpack this!
We can see that class B has both the shortest and the tallest person in Year 9 since box plot B starts and ends at both a smaller and a higher value than A.
From that, we can also conclude that the range of the heights in class B is higher than that of class A.
This means that the data is spread out over a larger distance - we can see this even from the first glance: B occupies much more space than A!

Similarly, we could also see that the box in B is much longer than in A.
That means that the middle 50% of the data is spread out more in B than in A, i.e. the interquartile range is higher in B than A.
The box also starts at a smaller value at B than at A so B's lower quartile is smaller than A's!
The upper quartile in both is 170 cm which means that 25% (or one quarter) of students in both classes are taller than 170 cm.
Finally, the only average that we can read off a box plot, the median, (which is the line inside the box) is much higher in A than B.
That means that on average, students in class A are taller!
So we can conclude the following main points:
- On average, the students in class A are taller.
- However, the tallest person is in class B (and so is the shortest one).
- Students in class A are of more similar height as the range is smaller (so the data is less spread out).
- The middle 50% of students' heights is also spread out less in class A.
That's a lot of information from just two box plots!

Let's have a go at some questions!


