


There are a number of ways you can find probability for more than one event. You could use sample space diagrams, two-way tables or the and/or rules.
One of the most versatile methods is the tree diagram.
In these, multiple events can be shown without having to draw every single outcome.
We use tree diagrams to systematically list the outcomes of events.
Imagine that you were finding the probability of getting a six on a dice - do you need to know every outcome? No, just the ones that involve the sixes.
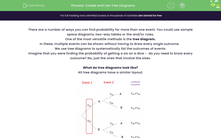
What do tree diagrams look like?
All tree diagrams have a similar layout:
At first glance, this looks really complicated, but let's work it through with an example.
Example 1:
I flip a weighted coin twice where P(H) = 2/3
Draw a tree diagram to show all the outcomes.
In this question, we know a couple of things straight away:
1) We know that the chance of getting a head is 2/3. This means that the probability of getting tails is 1/3 (These have to add up to 1)
2) We are flipping the coin twice. This means we have two events with two outcomes each.
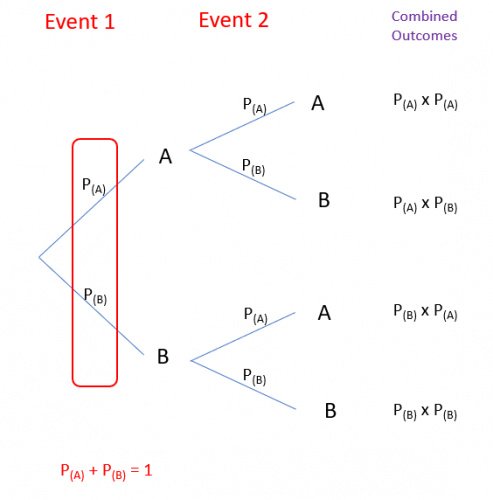
Let's start by looking at what could happen the first time we flip the coin:
We can get either a head or a tail - that's it.
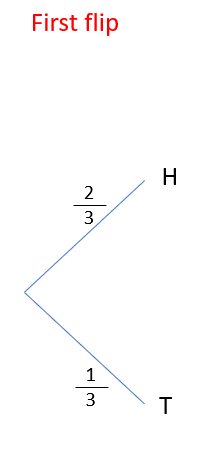
Let's now look at the second branches. If I got a head on the first flip, it wouldn't change what I could get or the probabilities, so I can draw another branch.
I can then also do the same for if I get tails the first time.

Now I have the structure, I can start to look at the outcomes, You should be able to see from this tree diagram that if I flip a coin twice, I could get four different outcomes HH HT TH and TT.
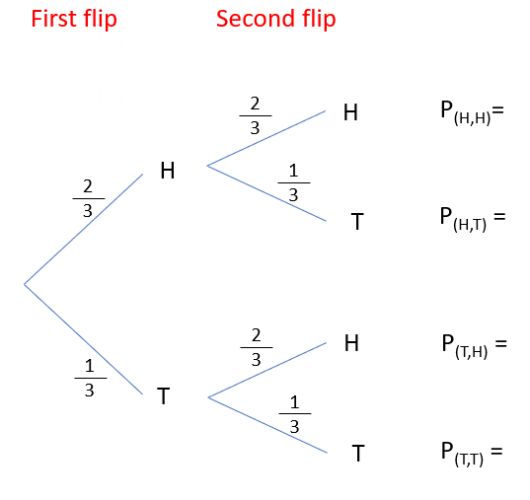
I now need to find the probabilities of each of these outcomes.
For example. P(HH) = P(H) x P(H) = 2/3 x 2/3 = 4/9

The last step to check we have done this correctly is to look at these four new probabilities at the end.

They describe everything that could happen, so they must add up to 1.
How do we use this?
Tree diagrams are all about finding probabilities for combined events.
Let's look at an example.
What is the probability that I throw a coin twice and get one head and one tail?
There are two ways this can happen: HT and TH
All we have to do is find the ones on the tree that show this and add them together.
They're the middle two: 2/9 + 2/9 = 4/9
Let's move on to some questions now.


