EdPlace's Year 9 home learning maths lesson: Finding Averages Using Frequency Tables
Looking for short lessons to keep your child engaged and learning? Our experienced team of teachers have created English, maths and science lessons for the home, so your child can learn no matter where they are. And, as all activities are self-marked, you really can encourage your child to be an independent learner.
Get them started on the lesson below and then jump into our teacher-created activities to practice what they've learnt. We've recommended five to ensure they feel secure in their knowledge - 5-a-day helps keeps the learning loss at bay (or so we think!).
Are they keen to start practising straight away? Head to the bottom of the page to find the activities.
Now...onto the lesson!
Finding the Mean using a New Method!
Students will know from Key Stage 2 that finding the mean from a list of numbers consists of adding them all up and dividing by how many numbers are on the list. Frequency tables look more complicated – and many students find the topic confusing, however, to find the mean ultimately requires the exact same logic. We're going to look at how to find the mean from a frequency table in five simple steps. We're confident that if your child follows the 5 steps below, put together by our maths teachers, they'll feel confident when asked to:
1) Interpret a frequency table as a way of presenting a list of numbers
2) Calculate the mean using a frequency table, using the correct combination of multiplication, addition and division
3) Evaluate their answer to check if it fits the range of data
What Information do Frequency Tables Show?
The first thing we need to get to grips with is understanding what a frequency table actually shows. What is the purpose of a frequency table? What information does it express? Let's look at an example below:
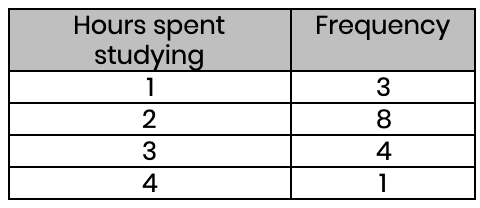
The purpose of a frequency table is to summarise a list of numbers. So, this table shows the number of hours spent studying, and how many students study for that amount of time. In this case, our table summarises that we have three 1s, eight 2s, four 3s, and one 4. It could have been written as a list like this: 1, 1, 1, 2, 2, 2, 2, 2, 2, 2, 2, 3, 3, 3, 3, 4. But obviously, a table is clearer and easier to digest!
Step 1 - Calculating the Mean Using Frequency Tables
As we know, to find the mean, we add all our numbers up and divide by how many numbers we have. Some exam questions have frequency tables that summarise hundreds - or even thousands - of numbers, so writing each number out as a list wouldn’t be a good idea!
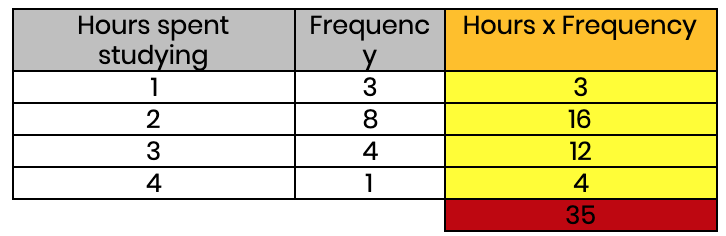
First, we multiply our two original rows together to create a new column that expresses: hours spent studying × the number of students who study for that number of hours.
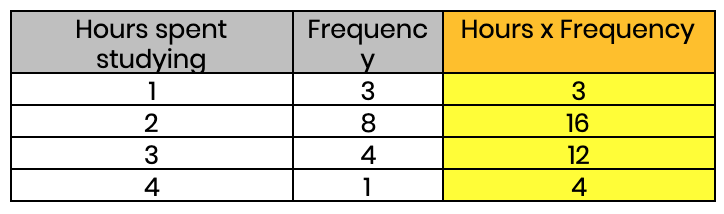
Step 2 - Find the Total of the New Column
Next, we add up the new column.
Let's pause for a minute to understand why we have done this (many students do not realise how this leads to the mean). We mentioned earlier that the data in this table could have been written as 1, 1, 1, 2, 2, 2, 2, 2, 2, 2, 2, 3, 3, 3, 3, 4. Now, look what happens if we add up this same list: 1+1+1+1+2+2+2+2+2+2+2+2+3+3+3+3+4 = 35!
It's important to understand that step 2 and step 3, gives us an enormous shortcut. They allow us to add up all the numbers from our list without needing to write them all out individually.
Step 3 - Add it All Together
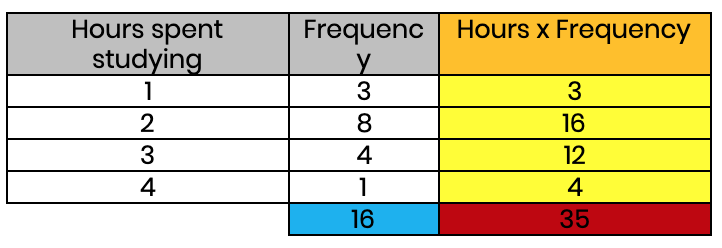
Keeping in mind that the mean is just all the values added together and divided by the number of values, the only thing left to do is divide. However, often students fall at the last hurdle here and divide by the wrong thing! So let's look again at the table:
A common mistake is to look at the number of rows and say: “it adds up to 35 and there are 4 rows, so the mean is 35 ÷ 4”. We must remember that we need to divide by how many pieces of data there are. In other words, the number we want is the total frequency. In this case, 3 + 8 + 4 + 1 = 16 (i.e. there were 16 students in this survey).
Below is the final table.
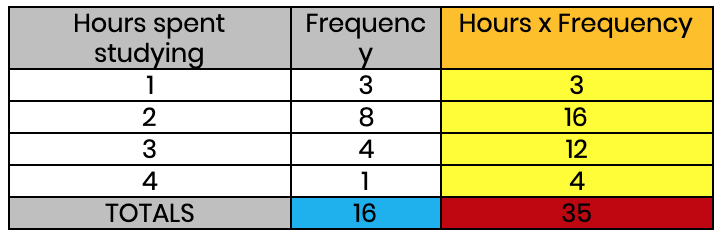
The final step is simply dividing the total of the data by the total frequency. 35 ÷ 16 = 2.1875 hours. The average student on this survey spends just over 2 hours studying (we are assuming this is per day!) It’s normal to get a decimal as a mean. A good way of checking the answer is correct is to look at the range of data. In this example, it ranges from 1 hour to 4 hours, so the mean must be between those two numbers. If we had ended up with a mean greater than 4 or less than 1, then something must have gone wrong.
Step 4 - Putting it into Practice
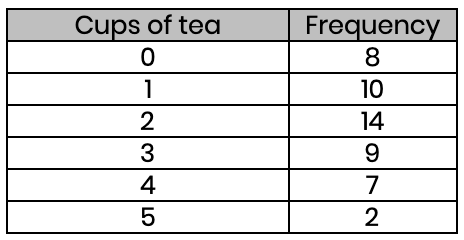
Now, using the guide above, see if you can now find the mean using the frequency tables below.
(a) Find the average number of cups of tea that people drink.
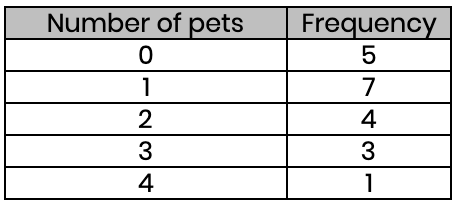
(b) Find the average number of pets people have
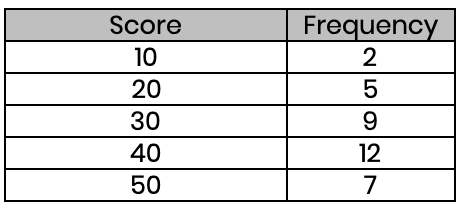
(c) Find the average score in these exams (to the nearest whole number)
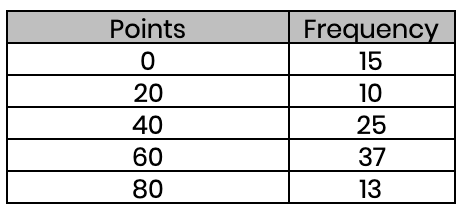
(d) Find the average points these sports teams scored (to the nearest whole number)
Step 5 - Give it a go...
Why not test your understanding and see if you can tackle these activities?
All activities are created by teachers and automatically marked. Plus, with an EdPlace subscription, we can automatically progress your child at a level that's right for them. Sending you progress reports along the way so you can track and measure progress, together - brilliant!
Activity 1 - Mean, Median, Mode and Range
Activity 2 - Averages from Frequency Charts
Activity 3 - Finding the Mean from Frequency Tables
Activity 4 - Averages from Frequency Tables
Activity 5 - Averages from Grouped Data
Answers
a)
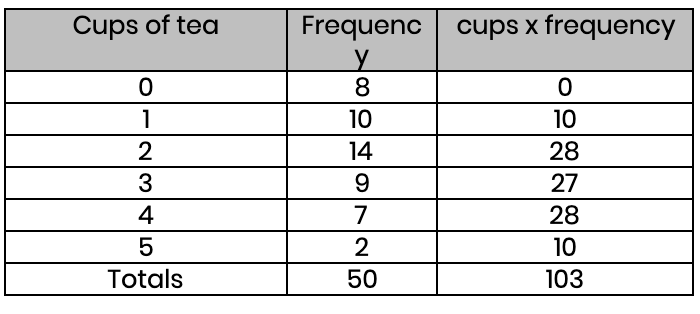
Mean = 103 ÷ 50 = 2.06
b)
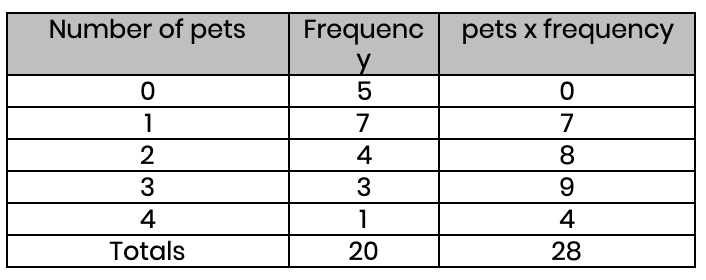
Mean = 28 ÷ 20 = 1.4
c)
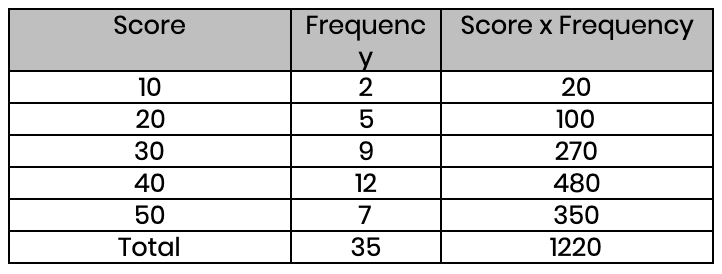
Mean = 1220 ÷ 35 = 35 (nearest whole number)
d)
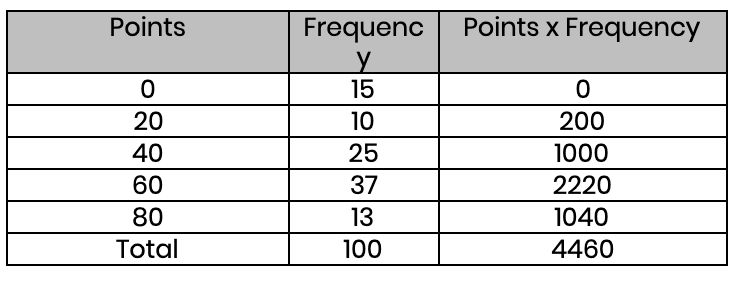
Mean = 4460 ÷ 100 = 45 (nearest whole number)
Keep going! Looking for more activities, different subjects or year groups?
Click the button below to view the EdPlace English, maths, science and 11+ activity library