Loading please wait

The smart way to improve grades

Comprehensive & curriculum aligned

Try an activity or get started for free

Statistics: Reading a Speed-Time Graph

In this worksheet, students read information from a speed-time graph and answer questions about it.

'Statistics: Reading a Speed-Time Graph' worksheet

Key stage:  KS 2

Year:  Year 5 Maths worksheets

Curriculum topic:   Statistics

Curriculum subtopic:   Use Line Graphs

Difficulty level:  

Worksheet Overview

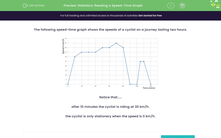
The following speed-time graph shows the speeds of a cyclist on a journey lasting two hours.


Speed-time graph


Notice that.....


after 10 minutes the cyclist is riding at 30 km/h.


the cyclist is only stationery when the speed is 0 km/h.


Example question:


At how many minutes was the cyclist travelling at 45 km/h?


Answer:

70

If we look at the mark by 45 km/h and follow it down to the x-axis, we can see that it is 70 minutes.

What is EdPlace?

We're your National Curriculum aligned online education content provider helping each child succeed in English, maths and science from year 1 to GCSE. With an EdPlace account you’ll be able to track and measure progress, helping each child achieve their best. We build confidence and attainment by personalising each child’s learning at a level that suits them.

Get started
laptop

Try an activity or get started for free