


When you are dealing with straight lines, you should be familiar with the equation y = mx + c.
In this, the value of m is the gradient (how steep the graph is) and c is the intercept (where the line crosses the y-axis)
When you have the equation of a linear graph, finding these values is quite straight-forward. All you have to do is rearrange the equation into the form
y = mx + c and then read off the values.
Example:
Find the gradient and intercept of the straight line y – 3x = 5
Step 1: Rearrange into the form y = mx + c
y – 3x = 5 → y = 3x + 5
Step 2: Read off the values of m and c
m = 3, c = 5
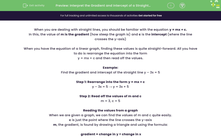
Reading the values from a graph
When we are given a graph, we can find the values of m and c quite easily.
c is just the point where the line crosses the y-axis
m, the gradient, is found by drawing a triangle and using the formula:
gradient = change in y ÷ change in x
Example:
Find the equation of the straight line in this graph:
From the graph, we can see that m = 2 and c = 1. This gives the equation y = 2x + 1
What do m and c actually mean?
To answer this, we need to look at the context of the question, as they mean something different each time. However, they can be summarised as:
Gradient: The rate of change per unit.
This might mean for example, how much something changes per minute, per mile etc. It all depends on the question.
Y-intercept: The initial value.
This could be, for example, how much you pay for a taxi before you move (the standing charge).
Example:
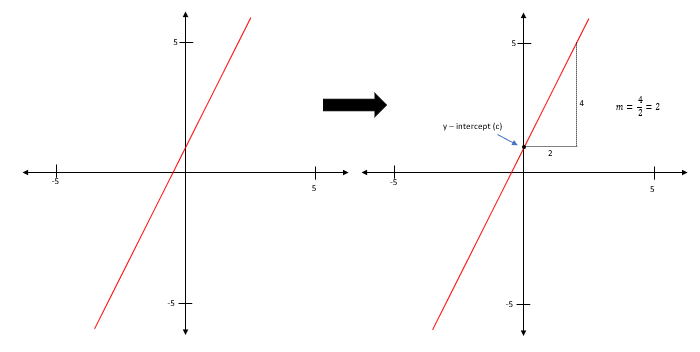
A candle is lit and its height is measured each hour until it burns out 8 hours later. These heights are recorded on a graph:
Find the equation of the line
We can see immediately that the line crosses the y-axis at 50, so we know that c = 50.
The gradient can be found by gradient = change in y ÷ change in x. If we use the values of 50 and 8, we get that the gradient = 50 ÷ 8 = 12.5
Be careful here though, the line is going down, so the gradient will be negative: m = -12.5
The equation of the line is: y = -12.5x + 50
What do the gradient and intercept represent?
The value of c (50) is the height when the time = 0 (the candle is lit).
This can be described as the initial height of the candle.
The value of m (-12.5) represents the change in height for each unit (hours in this case).
This means the height reduces by 12.5 cm each hour (this could be phrased as ‘the candle burns at 12.5 cm per hour’).
Let's move on to some questions.


