


When you are dealing with quadratics, you are expected to be able to use graphs to find approximate solutions for equations. There are two distinct ways this can be done.
These questions will usually come at the end of a question about drawing a quadratic.
Example 1:
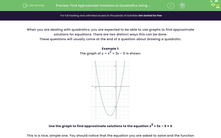
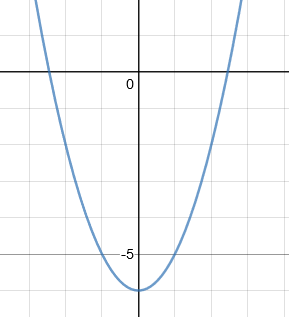
The graph of y = x2 + 3x – 5 is shown:

Use the graph to find approximate solutions to the equation x2 + 3x – 5 = 0
This is a nice, simple one. You should notice that the equation you are asked to solve and the function that is drawn is almost exactly the same.
The only difference is that the graph is y = and the equation is = 0.
All this means is that you need to find the points on the graph where y = 0. These will occur on the x-axis.
We can now simply read off the values.
x1 = -4.2 and x2 = 1.2
Don’t forget that because you are reading from a graph, you will always get a bit of leeway for error. In this case, you would have got the mark for ± 0.1.
Example 2:
The graph of y = x2 + 3x – 5 is shown:
Use the graph to find the solution for x2 – 6 = 0
To solve this, you need to manipulate the equation you are asked to solve so that one side is the same as the graph you have drawn.
x2 – 6 = 3x
x2 + 3x – 6 = 3x {Add 3x to both sides}
x2 + 3x – 5 = 3x + 1 {Add 1 to both sides}
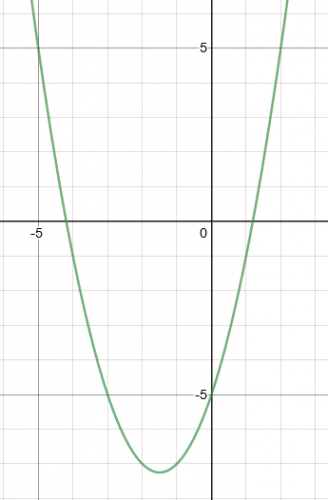
Now that we have the left-hand side as the function we have drawn, we need to draw the other function
(y = 3x + 1) on the graph and look where they intersect:
From this, we can read off the two values that are the solutions to x2 – 6 = 0
x1 = -2.5 and x2 = 2.5
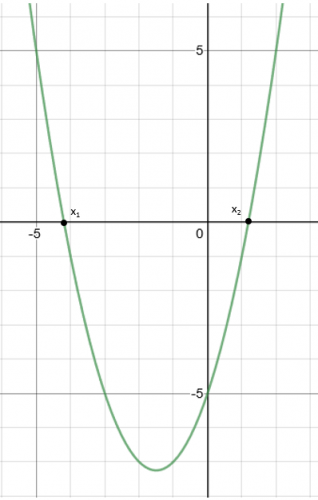
If we wanted to check these solutions, we could plot the function y = x2 – 6. We would get the following graph:
From this, we can see that the solutions for this are x1 = -2.5 and x2 = 2.5 showing that our answers are correct.
Let's move on to some questions now.


