


Sometimes it is important to be able to visualise a journey in maths. One way to do this is to use a distance-time graph, but this only works if the object is moving at a constant speed or has stopped. If we want to deal with something that is changing its speed, we have to use a speed-time graph.
You may also see this called a velocity-time graph. Without going into ridiculous detail for the reason why, you can just use either and deal with it the same way.
What is a speed-time graph?
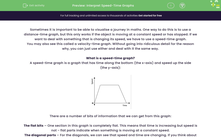
A speed-time graph is a graph that has time along the bottom (the x-axis) and speed up the side
(the y-axis):
There are a number of bits of information that we can get from this graph:
The flat bits – One section in this graph is completely flat. This means that time is increasing but speed is not - flat parts indicate when something is moving at a constant speed.
The diagonal parts – For the diagonals, we can see that speed and time are changing. If you think about it, the gradient of the diagonal is the speed divided by the time.
Speed ÷ Time = Acceleration
The gradient of the diagonal parts of the speed- time graph gives the acceleration.
The steeper the line, the faster the object is accelerating.
The area under the graph
This is something you just have to know. For a speed-time graph, the area under the graph represents the distance travelled. The easiest way to do this is to split the graph into triangles and rectangles, find the area and then add them together.
Example 1:
A heavy goods train leaves a station and accelerates to 150 mph in 30 minutes. It maintains this speed for 15 minutes and then brakes, coming smoothly to a stop at another station 45 minutes later.
Draw a speed time graph for this information.
For this, we need to look at each stage of the question.
A heavy goods train leaves a station and accelerates to 150 mph in 30 minutes:
From this, we know that there will be a straight line that starts at 0 and goes up to a speed of 150 miles per hour in a time of 30 minutes.
It maintains this speed for 15 minutes:
The word maintains indicates that it is travelling at a constant speed - this will be drawn as a flat line for 15 minutes.
And then brakes, coming smoothly to a stop at another station 45 minutes later:
If the train is coming to a stop, the speed will go from 150 mph to zero over a period of 45 minutes.
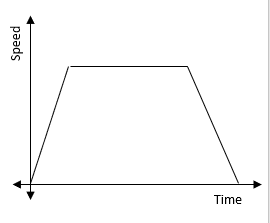
We can then put all this onto a speed-time graph:
How long is the journey between the two stations?
This can just be read from the speed–time graph. The journey takes 1 hour 45 minutes.
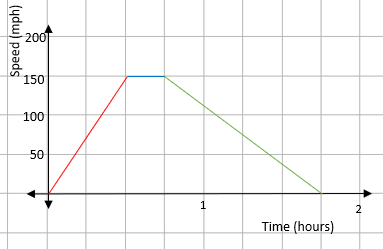
How far is it between the stations?
The distance between two points on a speed-time graph is given by the area under the graph. The first step is to split the shape up into other shapes that are easy to deal with:
We can now find the area of each part.
You do need to be careful with the times you use though. With the speed being in miles per hour, you must use hours for your time measurements.
AreaA = ½ x 0.5 x 150 = 37.5 miles
AreaB = 0.25 x 150 = 37.5 miles
AreaC = ½ x 1 x 150 = 75 miles
This gives a total distance of 37.5 + 37.5 + 75 = 150 miles.
Time for some questions now.


