

When you studied cumulative frequency diagrams, you will have come across finding the interquartile range.
The reason we find the interquartile range is to give a measure of consistency between two sets of data.
If we knock out the top 25% and the bottom 25%, we are only looking at how spread out the central 50% of the data is. The lower this value, the more consistent the data is.
How to find the quartiles
Quartile just means quarter. If we are doing this in a small data set, we need to find the numbers that are in the position 1/4 and 3/4 of the way along this.
We find the position of the lower and upper quartiles by using the formula:
| LQ | = |
|
| UQ | = |
|
Where n is the number of pieces of data in the list.
Example:
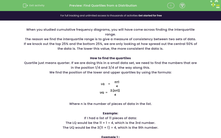
If I had a list of 11 pieces of data:
The LQ would be the 11 + 1 ÷ 4, which is the 3rd number.
The UQ would be the 3(11 + 1) ÷ 4, which is the 9th number.
Example 1 :
Finding the IQR
Find the interquartile range of the data set:
21, 23, 20, 27, 25, 24, 30, 21, 22, 28, 30
Step 1: Order the data
20, 21, 21, 22, 23, 24, 25, 27, 28, 30, 30
Step 2: Find the position of the quartiles
I have 11 pieces of data, this means that the LQ is the 3rd number and the UQ is the 9th.
Step 3: Find the value of the LQ and UQ
LQ = 3rd number = 21
UQ = 9th number = 28
Step 4: Find the IQR
IQR = UQ - LQ
28 - 21 = 7
Example 2:
Finding the IQR from a frequency table
This frequency table shows the results of a survey of the number of people in a car passing a particular point:
.
| People in a car | 1 | 2 | 3 | 4 | 5 | 6 |
| Frequency | 45 | 198 | 121 | 76 | 52 | 13 |
Find the IQR for this data.
Step 1: Find the total frequency for this problem
We just add up all the frequencies for this. This gives us 505 cars.
Step 2: Find the position of the quartiles
Using the formula above, the LQ is the 126.5th number and the UQ is the 379.5th number.
Step 3: Find the values of the quartiles
This is a bit complicated.
If we wrote the first column out as a list, we would write 45 numbers out - have we gone past 126.5th yet? No.
If we then write out the second column as a list, we would have 45 + 198 = 243 numbers - have we gone past 126.5th yet? Yes!
My LQ must be in the second column, so it must be 2.
If you do the same for the UQ, you find that UQ = 4.
Step 4: Find the IQR
IQR = UQ - LQ
4 - 2 = 2
Let's have a go at some questions now.


