


When we draw scatter diagrams, we can spot whether or not two variables are connected. To be able to use this to make predictions, we must draw a line of best fit.
What is a line of best fit?
A line of best fit is a straight line that we draw on the scatter graph, showing the trend or pattern.
When we are drawing it, there are three points to remember:
It must follow the pattern, for example, bottom left to top right for a positive correlation.
It must go through the middle of the pattern with about the same number of points above the line as below.
It does not have to go through the zero.
What is a line of best fit for?
We already know that scatter graphs show the connection between two variables; a line of best fit allows us to make predictions based on this connection.
Example :
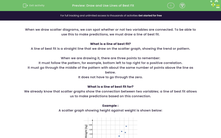
A scatter graph showing height against weight is shown below:

Draw a line of best fit.
Following the points above, the line of best fit goes through the middle of the pattern, has a similar number of points above and below the line (7 above, 6 below and 1 on the line) and doesn’t go through the origin.
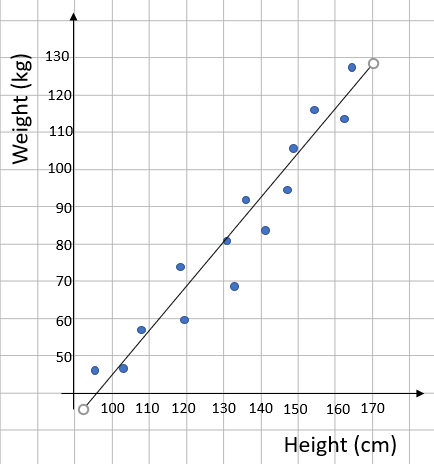
Predict how much a man who is 125 cm tall might weigh.
We know the man is 125 cm tall, so we draw a line up from 125 cm to the line of best fit. We then draw across to the weight axis. We can predict that he weighs about 75 - 76 kg.
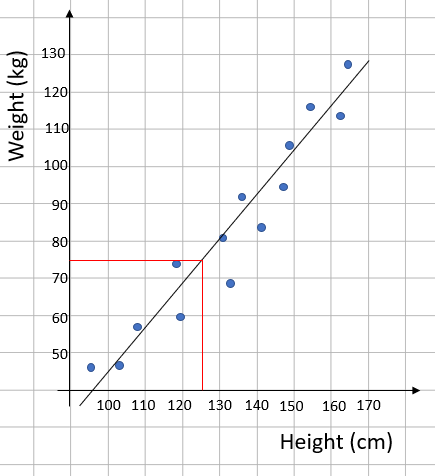
If a woman weighs 100 kg, how tall might she be?
This is very similar to the previous question but this time we start from the weight axis, go across to the line of best fit and then read down to the height. We can say she is about 147 cm tall.
As you are reading off a graph, you will always get a bit of a margin for your answers.
Let's try some questions now.


