
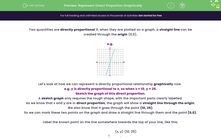


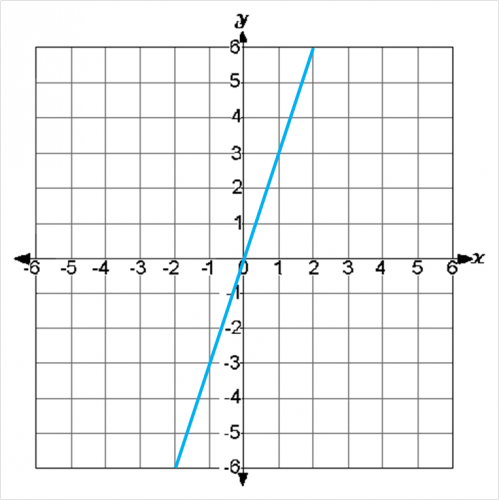
Two quantities are directly proportional if, when they are plotted on a graph, a straight line can be created through the origin (0,0).
e.g.
Let's look at how we can represent a directly proportional relationship graphically now.
e.g. y is directly proportional to x, so when x = 10, y = 25.
Sketch the graph of this direct proportion.
A sketch graph only requires the rough shape, with the important parts clearly labelled.
As we know that x and y are in direct proportion, the graph will show a straight line through the origin.
We also know that it goes through the point (10, 25).
So we can mark these two points on the graph and draw a straight line through them and the point (0,0).
Label the known point on the line somewhere towards the top of your line, like this:
(x, y) (10, 25)
How easy is that?!
The other task that you may be asked to complete using graphs of direct proportion, is to work out the coordinates from information which has been provided.
Let's take a look at this in action now.
e.g. y is directly proportional to x. Using this information, complete the table below.
| x | 3 | 5 | 10 | 12 | |
| y | 25 | 100 |
Hurray! We have been given information to work from, which makes this task so much easier.
From the table we can see that x = 5 when y = 25, so if we divide y by x, we will find our faithful friend the multiplier:
25 ÷ 5 = 5
Now we can multiply each value of x in the table by 5 to find the corresponding missing value of y, or divide each value of y by 5 to find the corresponding missing value of x:
| x | 3 | 5 | 10 | 12 | 100 ÷ 5 = 20 |
| y | 3 × 5 = 15 | 25 | 10 × 5 = 50 | 12 × 5 = 60 | 100 |
Once we have our values, we can draw a graph if requested.
Remember that we are looking for a straight line which passes through the point (0, 0).
If your line is ever a bit wonky, go back and check your table of values.
Don't try and disguise the line as being straight, even it is tempting to do so.

Hey presto... that is all there is to it!
Direct proportion graphs can be used to work out all sorts of things, like currency conversion and fuel consumption.
In this activity, you will represent directly proportional relationships graphically and use these to solve real life problems or find missing / incorrect values.
You will need to have some graph paper and a pencil handy so that you can create your graphs.
You cannot upload your graphs to our system, but you will need to use them to answer related questions which will check whether they are correct or incorrect.


