


In probability, there are two distinct types of events, conditional and independent.
Independent events - the outcome of the first one does not affect the outcome of the second.
Conditional events - the outcome of the first event does affect the outcome of the second.
If you are unclear about how to draw tree diagrams, have a go at completing activity 6141 before tackling this one.
Example:
I have a bag that contains 5 black balls and 5 white balls. I pull one out, don't replace it and then pull another one out.
The key thing to note here is that the question says 'don't replace'. This means that we are dealing with conditional probability.
Let's start by looking at what could happen the first time we pull out a ball:

We can get either black or white. There's 5 of each, so the probabilities are both 1/2
Let's now look at the second branches. If I pulled out a black the first time, I would now have 4 black and 5 white balls.
This is going to change the probabilities:

I can now do the same for if I draw out a white ball first.
If I pulled out a white first, I would then have 5 black balls and 4 white balls.
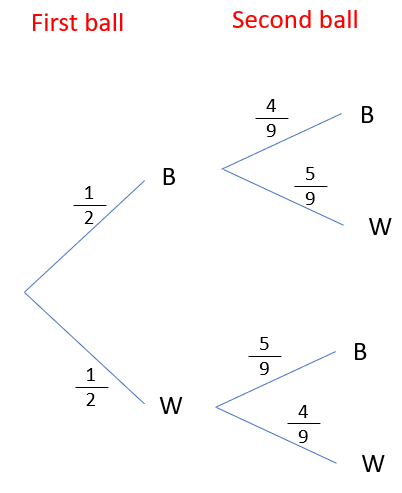
From here, I can complete this the same way that I would for a normal probability tree:
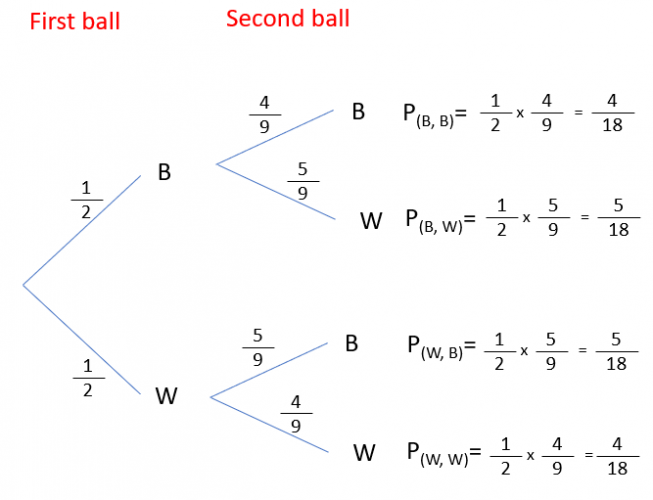
You could cancel these fractions down now, but it is probably better to leave them at this point. In a moment you might have to add them together, and if they all have the same denominator it'll be much easier.
We can always cancel down at the end.
How do we use this?
Tree diagrams are all about finding probabilities for combined events.
Lets look at an example.
What is the probability that I pull out at least one black ball?
There are three ways that this could happen: BB, BW and WB
All we have to do is find the ones on the tree that show this and add them together.
They're the top three:
4/18 + 5/18 + 5/18 = 14/18 = 7/9
Now let's have a go at some questions.


