

The way scientists collect evidence and present their results depends on the type of experiment they are doing and what they are measuring.
In this activity, you will be taken through various types of results you will come across in Year 7 from biology, chemistry and physics.
Cells
One of the first topics you will do in Year 7 is cells - the building blocks of life. You may have to observe live cells under a microscope. Scientists have to do this in order to determine what type of cell one is, as they may be trying to identify a pathogen - a microorganism that causes disease, for example a germ. You will not deal with microorganisms at school, but other types of cells, like onion cells.
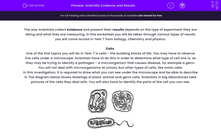
In this investigation, it is required to draw what you can see under the microscope and be able to describe it. The diagram below shows drawings of plant, animal and germ cells. Scientists in big laboratories take pictures of the cells they deal with. You will also have to identify the parts of the cell you can see.
Animal Behaviour
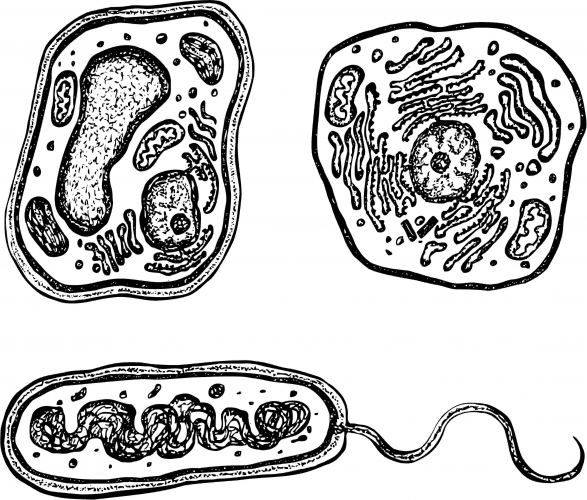
This type of investigation involves observing the behaviour of animals in relation to aggression, courtship or searching for food, over a long period of time. Scientists have to record their observations and write them up in such a way as to help others understand the order and meaning of observed behaviours. Photographs and videos are also helpful. The picture shows a birdwatcher observing a seabird.
Chemical Reactions and Measurements in Physics
Many chemistry experiments are based on chemical reactions. Scientists may have to measure the temperature of reactions, the time it takes for a reaction to occur, the products of the reaction, the pH of the final products and many other things. Experiments like these are dealt with in other activities. Generally, these types of results are recorded on a table and then they are plotted on a graph.
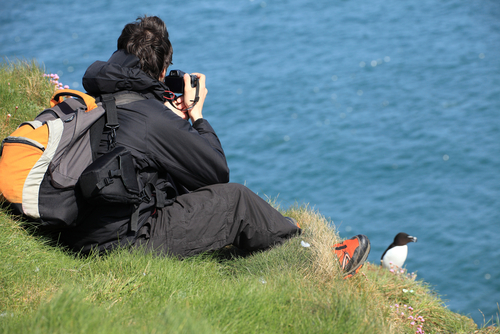
Tables and graphs are also used in physics experiments, for example measuring speed, pressure and energy. There is a table and a picture of graphs below, so you can see what they could look like. Bear in mind that there are many different types of graphs.
| Surface | Speed of toy car (m/s) |
| Carpet | 1 |
| Bench | 2 |
| Rough wood | 1.5 |
Are you ready to have a go at some questions now?


