A Venn Diagram shows information inside two 'circles' in a rectangular grid.
Check the numbers in this Venn Diagram, making sure that you understand why each number is where it is.
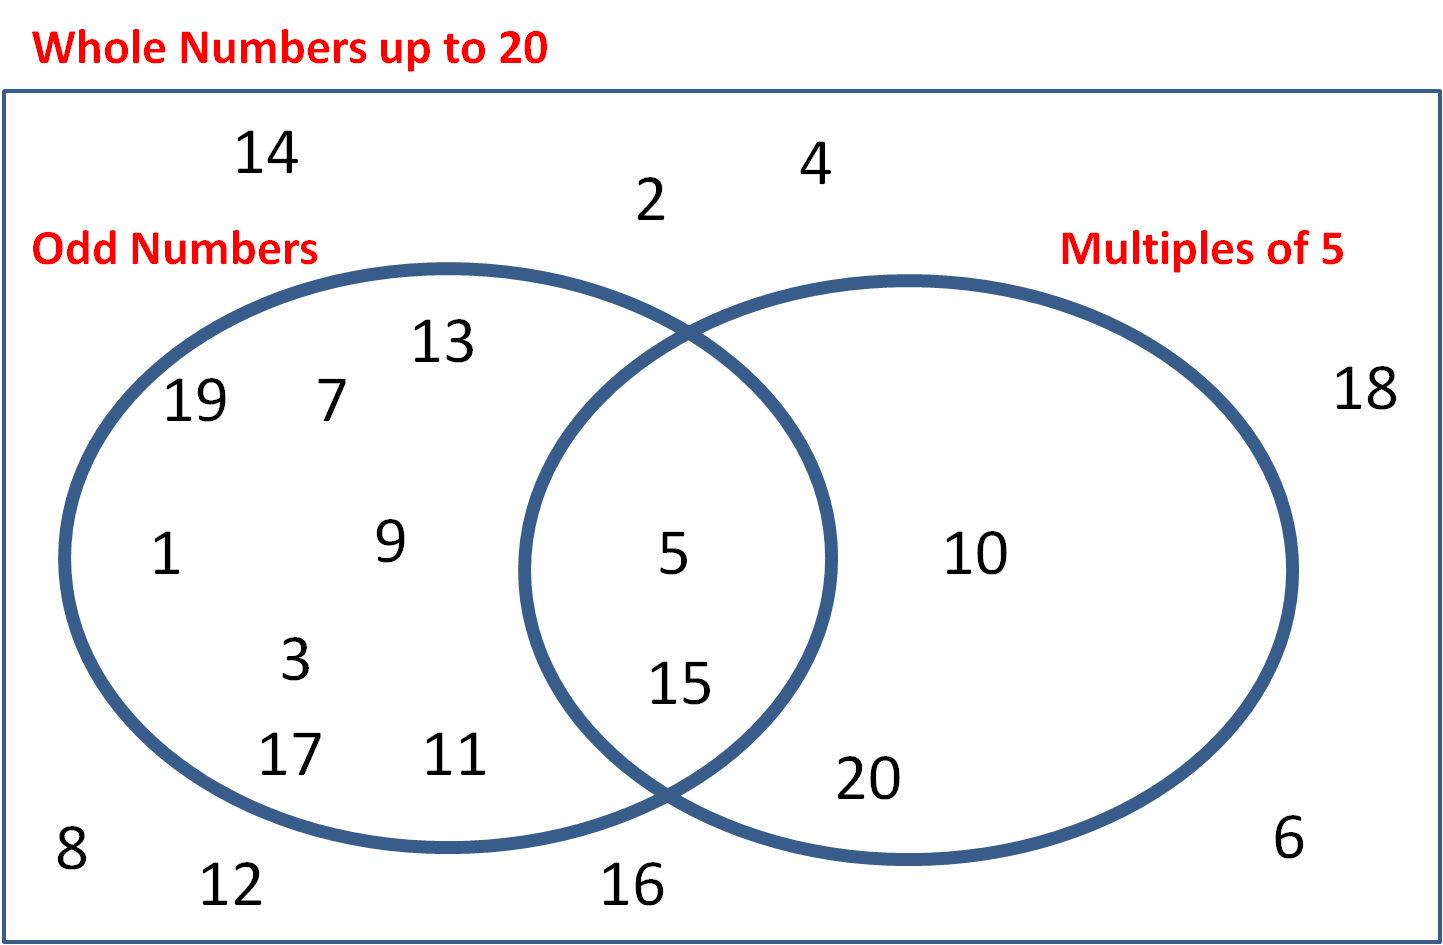

In this worksheet, students answer questions related to a diagram.
![]() This content is premium and exclusive to EdPlace subscribers. Sign up now.
This content is premium and exclusive to EdPlace subscribers. Sign up now.
Key stage: KS 2
Year: Year 3 11+ worksheets
Curriculum topic: Maths and Numerical Reasoning
Curriculum subtopic: Interpreting Data
Difficulty level: 

We're here to help your child succeed. Track progress, measure results and access thousands of online tutorial worksheets in Maths, English and Science with an EdPlace subscription.
We're your National Curriculum aligned online education content provider helping each child succeed in English, maths and science from year 1 to GCSE. With an EdPlace account you’ll be able to track and measure progress, helping each child achieve their best. We build confidence and attainment by personalising each child’s learning at a level that suits them.
Get started
Try an activity or get started for free


