

In this activity, we will be learning how to answer questions by reading the information in a bar chart.
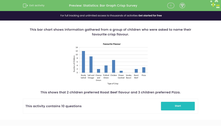
This bar chart shows information gathered from a group of children who were asked to name their favourite crisp flavour.
This shows that two children preferred roast beef flavour and three children preferred pizza.
Let's try an example question together using this bar chart.
Example
How many children liked either prawn cocktail or pizza flavoured crisps?
Answer
To answer this question, we need to look carefully at the bar chart.
We can see that one child liked prawn cocktail and three liked pizza.
When it says either, it means that we need to find the total of the two.
To find the total, we add the numbers:
3 + 1 = 4
So, four children liked either prawn cocktail or pizza flavour crisps.
Now you're ready to tackle some questions by yourself. Good luck.


