Loading please wait

The smart way to improve grades

Comprehensive & curriculum aligned

Try an activity or get started for free

Statistics: Who Reads What?

In this worksheet, students read information from a pictogram table and answer questions about it.

'Statistics: Who Reads What?' worksheet

Key stage:  KS 2

Year:  Year 3 Maths worksheets

Curriculum topic:   Statistics

Curriculum subtopic:   Solve Statistic Problems

Difficulty level:  

Worksheet Overview

In this activity, we will learn to answer questions by reading the information in pictogram tables.


Here is a pictogram.

It shows the results of a survey, in which children of different ages are asked about their favourite types of books.

The key shows us that one stack of books represents three children.
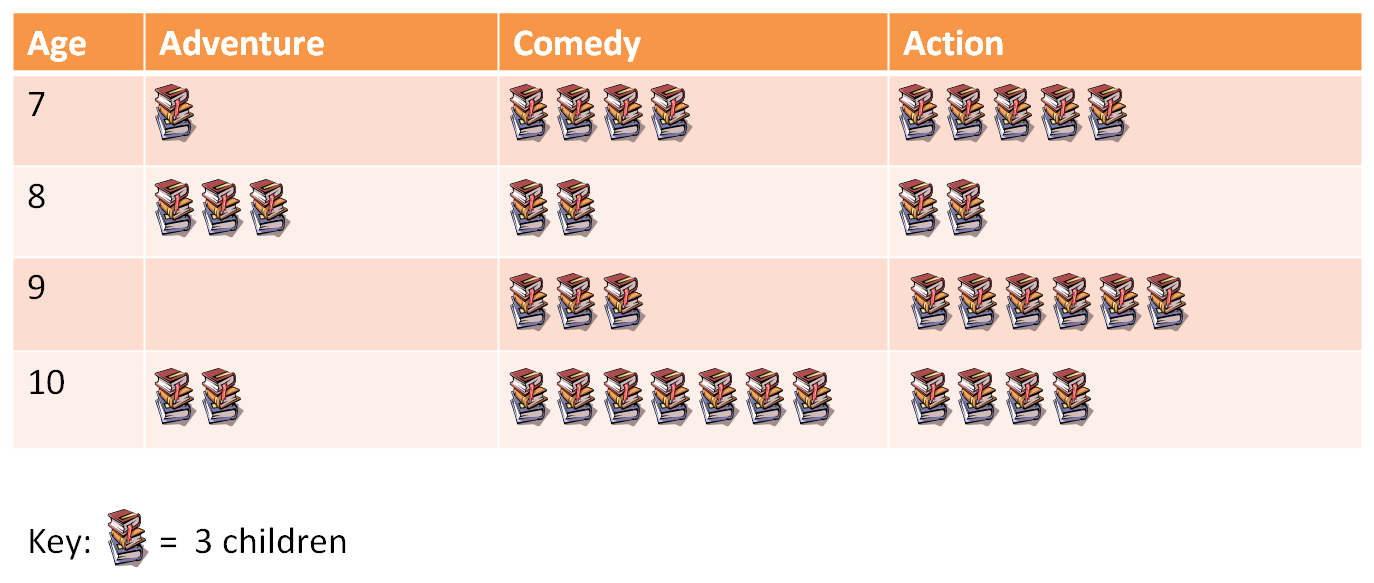
 

Book pictogram


The pictogram shows that six of the 10-year-olds chose Adventure books, while 12 10-year-olds chose Action books.


Let's try an example question together. 


Example

Which is the most popular type of book for 10-year-olds?


Answer

Looking carefully at the pictogram, we can see the following information:

6 ten years olds prefer Adventure books. 

21 ten years olds prefer Comedy books.

12 ten years old prefer Action books.

So, the most popular type of book for 10-year-olds is Comedy.


Now you are ready to try some questions by yourself. 

What is EdPlace?

We're your National Curriculum aligned online education content provider helping each child succeed in English, maths and science from year 1 to GCSE. With an EdPlace account you’ll be able to track and measure progress, helping each child achieve their best. We build confidence and attainment by personalising each child’s learning at a level that suits them.

Get started
laptop

Try an activity or get started for free