

In this activity, we will learn about how to use the information shown in a simple pictogram to answer questions.
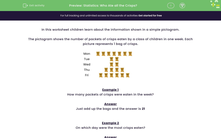
The pictogram below shows the number of packets of crisps eaten by a class of children in one week.
Each picture represents one bag of crisps.
| Mon |  |
| Tue | |
| Wed | |
| Thu | |
| Fri | |
We can see that on a Monday, seven packets of crisps were eaten.
On Tuesday and Wednesday, four packets of crisps were eaten in total.
Let's try some example questions using the pictogram.
Example 1
How many packets of crisps were eaten in total during the week?
Answer
To find the weekly total, we need to add up the daily totals:
7 + 2 + 2 + 4 + 6 = 21
The total number of packets of crisps eaten that week is 21
Example 2
On which day were the most crisps eaten?
Answer
Just by looking at the pictogram, we can see that Monday has the largest number of pictures of packets of crisps.
So, Monday was the day most crisps were eaten.
Let's try some questions now.