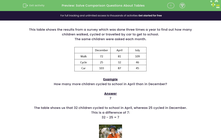
This table shows the results from a survey which was done three times a year to find out how many children walked, cycled or travelled by car to get to school.
The same children were asked each month.
Example
How many more children cycled to school in April than in December?
Answer
7
The table shows us that 32 children cycled to school in April, whereas 25 cycled in December.
This is a difference of 7:
32 - 25 = 7

Are you ready to have a go at answering some questions?


