Loading please wait

The smart way to improve grades

Comprehensive & curriculum aligned

Try an activity or get started for free

Read a Line Graph

In this worksheet, students will read information from a line graph and answer questions about it.

'Read a Line Graph ' worksheet

Key stage:  KS 2

Year:  Year 5 Maths worksheets

Curriculum topic:   Statistics

Curriculum subtopic:   Use Line Graphs

Difficulty level:  

Worksheet Overview

Look at this bar-line chart which shows how many times Jack cycled to school each week over a 20 week period.


Bar-line chart


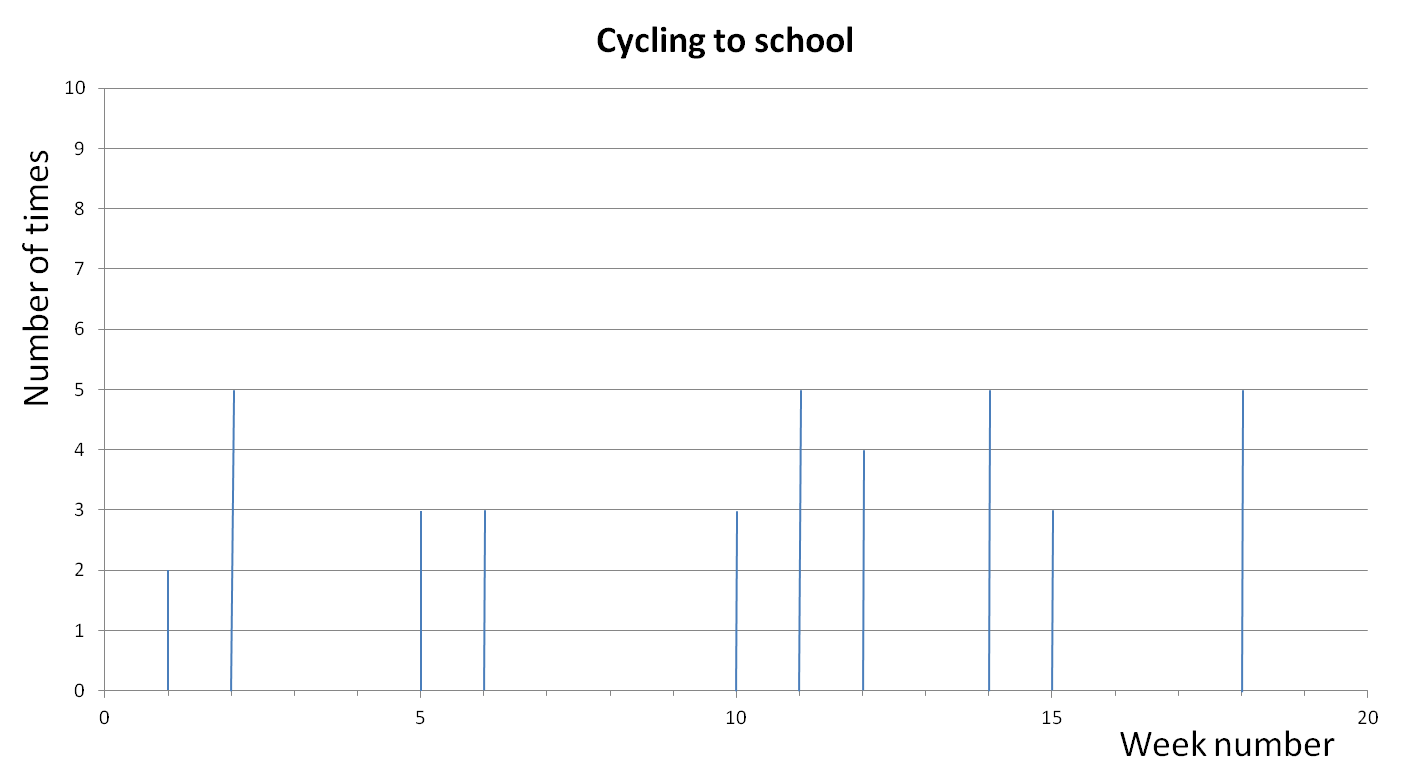
On week 1, Jack cycles to school twice.

On week 2, Jack cycles to school five times.

On week 3, Jack doesn't cycle to school.


Example

During how many weeks did Jack cycle to school three times?


Answer

If we look at the bar-line chart, we can see that Jack cycled to school three times during weeks 5, 6, 10 and 15. That is a total of four weeks.

The answer is therefore four.


boy on bike


Let's try some questions now.

What is EdPlace?

We're your National Curriculum aligned online education content provider helping each child succeed in English, maths and science from year 1 to GCSE. With an EdPlace account you’ll be able to track and measure progress, helping each child achieve their best. We build confidence and attainment by personalising each child’s learning at a level that suits them.

Get started
laptop

Try an activity or get started for free

  • National Tutoring Awards 2023 Shortlisted / Parents
    National Tutoring Awards 2023 Shortlisted
  • Private-Tutoring-WINNER-EducationInvestor-Awards / Parents
    Winner - Private Tutoring
  • Bett Awards Finalist / Parents
    Finalist
  • Winner - Best for Home Learning / Parents
    Winner - Best for Home Learning / Parents