


Do you like to read?
How many pages do you reckon you read a day?

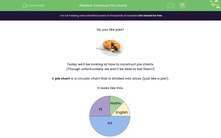
Tim recorded how many pages he read each day for 2 weeks:
9, 7, 8, 8, 8, 6, 8, 7, 8, 6, 7, 7, 9, 6
This is our data set.
It contains all the data that was collected.
It's not as easy to navigate though - especially if Tim continues and records a few months' worth of data!
We can organise it into a frequency table by counting how many times each data point appears (i.e. the frequency):
6 appears three times.
So 6 has the frequency of 3.
7 appears four times.
So has the frequency of 4.
And so on!
We can then construct our frequency table:
| Number of pages | Frequency |
|---|---|
| 6 | 3 |
| 7 | 4 |
| 8 | 5 |
| 9 | 2 |
We can double-check we've got it correct by adding all the frequencies to get how many data points we have:
3 + 4 + 5 + 2 = 14
And indeed, we had 14 numbers in the list!
So it all checks out.
Let's have a look at another example:
The science club at the EdPlace school gathered data on the monthly rainfall (in millimetres) for 12 different locations.

The recorded values are as follows:
Here we can see that each number is different.
So it doesn't really make sense to count how many times each appears - they all have frequency of 1!
That would make for a frequency table that wouldn't make our lives simpler:
It would be pretty much the list of the numbers, just listed vertically!
So instead, we categorise the data into intervals which we usually call classes.
Since the smallest number is 28.5 and the highest is 46.3, 28 and 47 is roughly where the intervals should start and finish.
We could then end up with something like this if we want to have an equal size of intervals:
| Monthly Rainfall (mm) | Frequency |
|---|---|
We can see that each interval occupies the space of 5 mm, so they are the same size.
To then get the frequencies, we see how many numbers satisfy each inequality.
For example, two numbers satisfy
So the class
| Monthly Rainfall (mm) | Frequency |
|---|---|
| 2 | |
| 6 | |
| 3 | |
| 1 |
We can check this is correct by adding all the frequencies:
2 + 6 + 3 + 1 = 12
And indeed, we had 12 data points!
However, we can see there are quite a lot of numbers in the class
| Monthly Rainfall (mm) | Frequency |
|---|---|
| 2 | |
| 1 | |
| 3 | |
| 2 | |
| 4 |
We can now see better that most of the numbers in the middle were between 34 and 38 mm!
The intervals are no longer an equal size though:
For example, we can see that the first interval occupies 30-28 = 2 mm, while the second 34-30 = 4 mm!
.jpg)
But that's ok!
There is no rule saying they have to be equal sizes - how we organise the data all depends on what we are trying to see and how we want to go about finding it!
Ready for some questions?


