


You are looking to buy a laptop.
When you come to the store, the shop assistant asks for the price range you are working with.

What does range mean in this context?
How is this different from what you know range is in maths?
.jpg)
'Range' in the first context means the group of prices that are within your budget.
Let's say this was £900-£1500.
Whereas one of the meanings of range in maths is the difference between the highest and the lowest value.
It measures the 'distance' between the highest and the lowest value.
For example, when the highest value is £1500 and the lowest value is £900, the range is:
£1500 - £900 = £600
Can we see how the £600 describes how much 'space' (i.e. the distance) there is between £900 and £1500?

Let's have a look at an example:
You are given a data set of the heights of buildings in a neighbourhood in the town of Bath (all in metres):
26, 19, 21, 21, 23, 28, 15, 17, 25, 23, 21, 25, 24, 24, 22, 20, 25, 19, 22, 31, 28, 23, 27, 21, 17, 20, 28, 18, 16, 21, 24, 16, 23, 22, 20
That's a lot of numbers, isn't it?!
The good news is that to find the range, we just need to identify the smallest and the largest numbers:
The smallest value: 15 m
The largest value: 31 m
The range is then 31 m - 15 m = 16 m!
.jpg)
Going through the whole list was a little tedious though, wasn't it?
The same data set could be presented in a table instead:
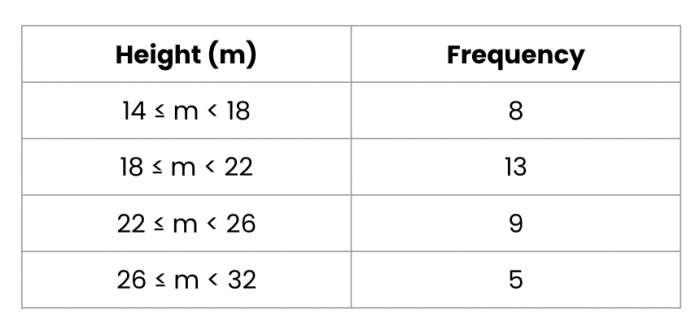
We now call this grouped data (because, well, we've grouped them!).
If we wanted to find the range from this table, we would again look at the highest and the lowest values of whatever it is we are measuring (height in this case!).
Here, the heights start at 14 m and end at 32 m.
So the range is:
32 m - 14 m = 18 m
But wait, how come this is different from our first calculation?!

Well, when we organise the data in a table like this, we lose some accuracy.
For example, we know that there are 8 numbers between the heights of 14 m and 18 m from the first line, but we don't know what exactly those numbers are.
So we lose some accuracy in the range as well!
Let's have a go at putting all this into practice!


