


Do you like movies?

A film critic collects ratings on a scale of 1 to 10 from 14 movie-goers after a screening of a new movie:
9, 7, 8, 8, 8, 6, 8, 7, 8, 6, 7, 7, 9, 6
To make it easier to analyse the data, the film critic decides to organise it into a frequency table by counting how many times each data point appears (i.e. the frequency):
| Rating | Frequency |
|---|---|
| 6 | 3 |
| 7 | 4 |
| 8 | 5 |
| 9 | 2 |
For example, 6 appeared three times, so 6 has the frequency of 3.

Frequency tables are a handy way to organise data that are on the same 'level'.
This means that the rating above was either 6, 7, 8 or 9 and we don't divide those movie-goers by any kind of demographic (age, gender etc.) or other e.g. comments about the movie.
But when we have subcategories, then a frequency tree would be much more appropriate.
Let's have a look at an example!
In Year 8, students can choose to study either French or Spanish.
We know that there are 80 students altogether.
38 students study French, out of which 17 are boys.
This can be represented by the following frequency tree:
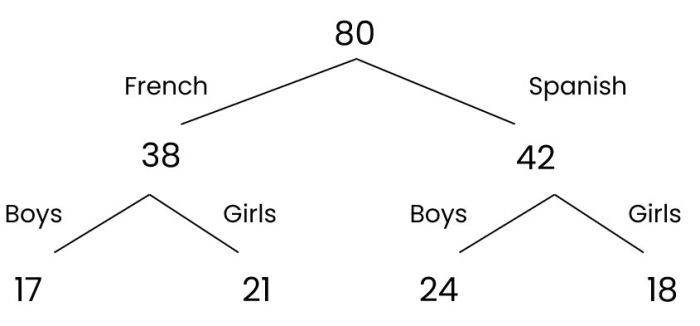
That is because:
- There are 80 students altogether, 38 of whom study French so 80 - 38 = 42 students study Spanish.
- We can then split both 38 and 42 into boys and girls.
- We know that 17 out of the 38 students studying French are boys so there are 38 - 17 = 21 girls studying French.
- Finally, we know that there are 41 boys altogether and can see that 17 of these boys study French so 41 - 17 = 24 boys study Spanish.
.jpg)
Frequency trees can be vertical ('up-down') like the example above or horizontal ('left to right).
Neither way is more correct - just depends on your preference!
Ready for some questions?


