

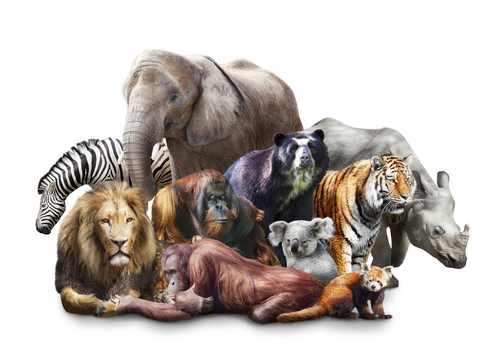
What is your favourite animal?
A zoo recorded the weights of different animal species in kilograms:
| Weight (kg) | Frequency |
|---|---|
| 100 ≤ w < 200 | 6 |
| 200 ≤ w < 300 | 8 |
| 300 ≤ w < 400 | 12 |
| 400 ≤ w < 500 | 10 |
| 500 ≤ w < 600 | 4 |
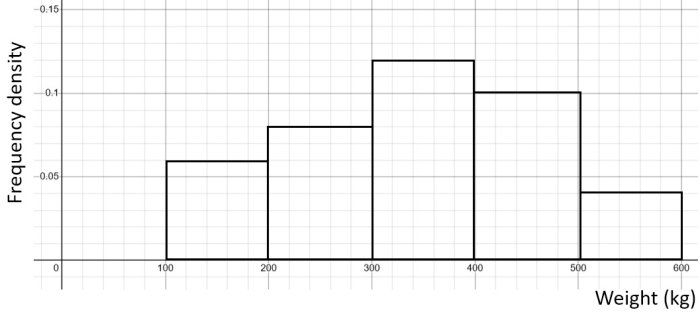
A histogram was created from this data:
What is a histogram?
.jpg)
It is tempting to say that it is just another name for a bar chart, since it does look very similar!
But there are a few key differences between a bar chart and a histogram:
Histograms are used for continuous data (data that can take on any value within a certain range e.g. time, height) while bar charts are used for discrete data (can only take certain values e.g. shoe size, number of siblings).
There are gaps between the bars in a bar chart, but no gaps in histograms since the data is continuous.
We always have frequency density on the y-axis in a histogram, whereas the y-axis could be a number of things in a bar chart (frequency, percentages etc.)
But wait, what is frequency density?!

Let's have a look back at our histogram to answer this:
We can see that the class 100 ≤ w < 200 has a frequency density of 0.06 and from the table, we know it has the frequency of 6.
How are these connected?
Well, 0.06 is 6 divided by 100.
Where did we get the 100 from?
It's the width of the class 100 ≤ w < 200!
That is the difference between the ends of the interval: 200 - 100 = 100
So frequency density can be calculated as:
Frequency density = frequency ÷ width of the interval
That means frequency density is the frequency per unit of whatever it is we are measuring (in this case weight, so per 1 kg).
That makes sense as if we think back to density in general (e.g. density of gold or water), it is mass per unit of volume!
For frequency density, we are just measuring frequency rather than mass (as the name suggests) and the volume, i.e. how much space it occupies, is the space the interval occupies.
So if we were to construct a histogram, we just create another column for frequency density to find what numbers we should have on the y-axis:
| Weight (kg) | Frequency | Frequency density |
|---|---|---|
| 100 ≤ w < 200 | 6 | 6 / 100 = 0.06 |
| 200 ≤ w < 300 | 8 | 8 / 100 = 0.08 |
| 300 ≤ w < 400 | 12 | 12 / 100 = 0.12 |
| 400 ≤ w < 500 | 10 | 10 / 100 = 0.1 |
| 500 ≤ w < 600 | 4 | 4 / 100 = 0.04 |
Since all intervals had the same width (100), we just divided the frequencies by 100 to get our frequency densities!
Ready to try to put it all into practice?


