

What subject would you consider stems and leaves a part of?

You might be thinking biology - but believe it or not, stems and leaves are also in maths!
A stem-and-leaf diagram (or stem-and-leaf plot) is a way to organise data in a more concise and easy-to-read way.
Let's have a look at an example!
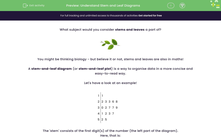
The 'stem' consists of the first digit(s) of the number (the left part of the diagram).
Here, that is:
1, 2, 3, 4, 5
The 'leaf' consists of the last digit and it is on the right of the vertical line.
We can the read all the data from the diagram by first reading the stem and then attaching the leaf to it.
For example, 1 | 1 represents 11.
So the second row of our diagram (the one with a stem of 2) consists of the following data:
22, 23, 23, 26, 28
That's not too bad, is it?!

Let's have a look at how we would organise raw data into a steam-and-leaf diagram:
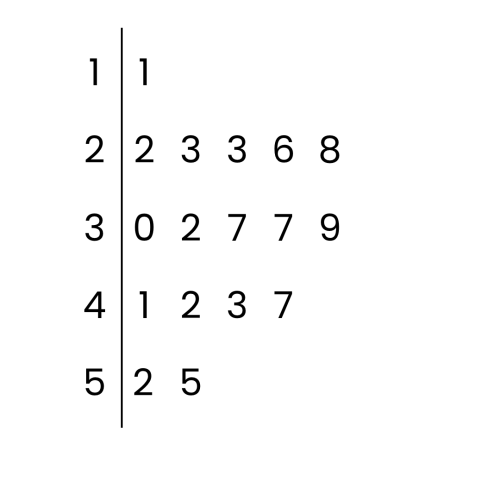
The following data on people's IQ was collected from a random sample:
122, 127, 113, 137, 113, 138, 101, 118, 120, 129, 145, 131, 132, 126, 133, 116, 142, 112
First, we order them from smallest to the biggest:
101, 112, 113, 113, 116, 118, 120, 122, 126, 127, 129, 131, 132, 133, 137, 138, 142, 145
We can see that all the numbers are higher than 100!
Since the leaf consists of the last digit only, our stem will be the first two digits of the numbers.
So the stem will consist of:
10, 11, 12, 13, 14
So it will look like this:

Since we have only one number starting with 10, i.e. 101, the first row will be:
10 | 1
We then get the other rows the same way:
We can use stem-and-leaf digrams to find our averages and range the same way that we would for any other data!
For example, we know that range is the difference between the highest and the lowest value.
The highest and the lowest values here are 145 and 101, so the range is 145 - 101 = 44!
Ready for some questions?