
How can we use tree diagrams to find probabilities?

We know that:
- Anytime we go along the same path in the diagram, we multiply the probabilities
- If we have two (or more) different paths, we add the probabilities
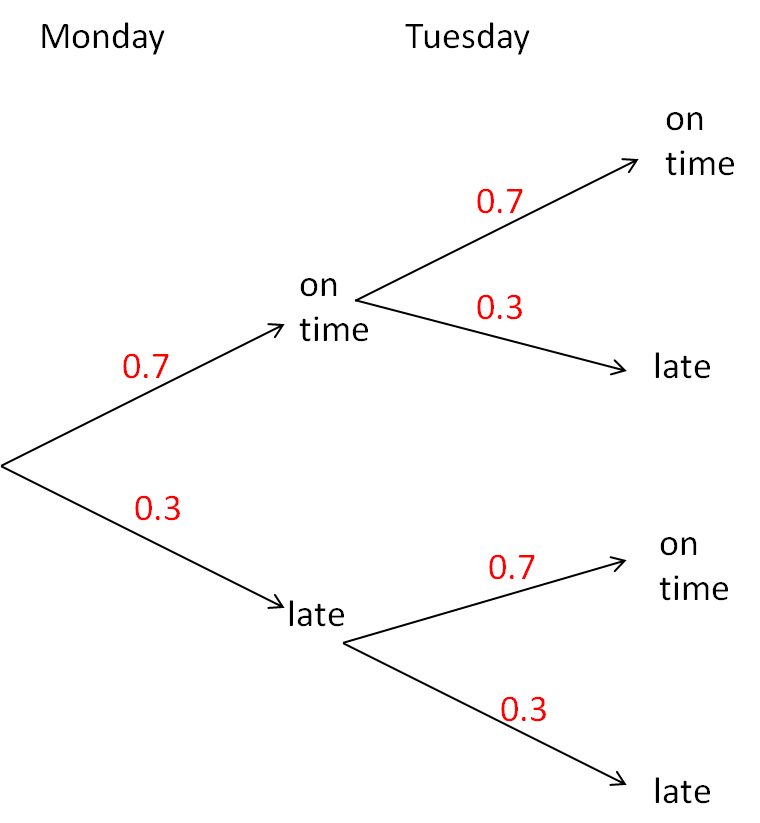
For example, if we wanted the probability that the bus is late on both days here:
We can see that the probability is a single path (late on Monday and Tuesday). It is marked in green below:
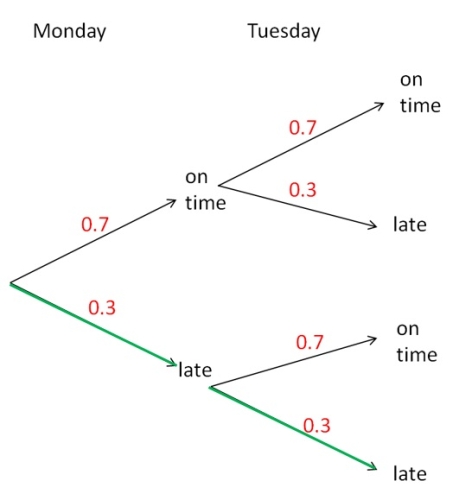
Anytime we are finding the probability of something 'and' something happening or the probability on the same path on the tree diagram, we multiply the probabilities:
P(late and late) = 0.3 x 0.3 = 0.09
If we wanted to find the probability that the bus is late on exactly one day, we have two possible paths to achieve such a scenario:
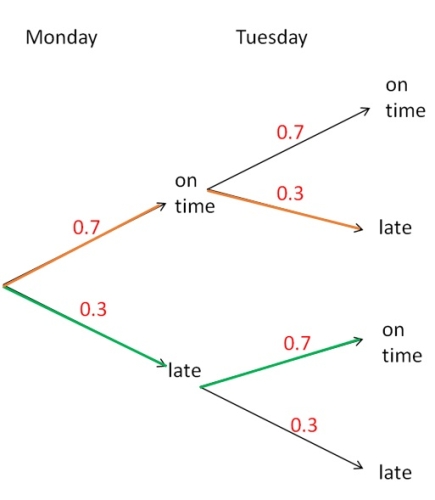
The orange path gives us:
P(on time and late) = 0.7 x 0.3 = 0.21
The green path gives us:
P(late and on time) = 0.3 x 0.7 = 0.21
Anytime we are finding the probability of something 'or' something happening or the probability of different paths on the tree diagram, we add the probabilities:
P(late on one day) = P(on time and late) + P(late and on time) = 0.21 + 0.21 = 0.42
Does that make sense?

This applies to all tree diagrams.
But we need to be careful because we don't always have the same probabilities for branches like in the one above!

For example, if there are 6 cherry sweets and 9 lemon sweets in a bag and two sweets are drawn, we get this diagram:
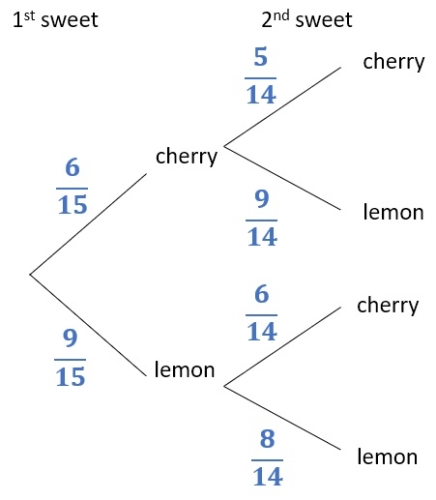
Here, the probabilities in the second branches are not the same because if we take one sweet already and don't replace it, it changes how many sweets we have for the second draw!
This is known as the without replacement scenario.
If on the other hand, we have an almost identical scenario (6 cherry sweets and 9 lemon sweets in a bag, two drawn) but this time we put the first sweet back after drawing it (with replacement), then we get a very different diagram:
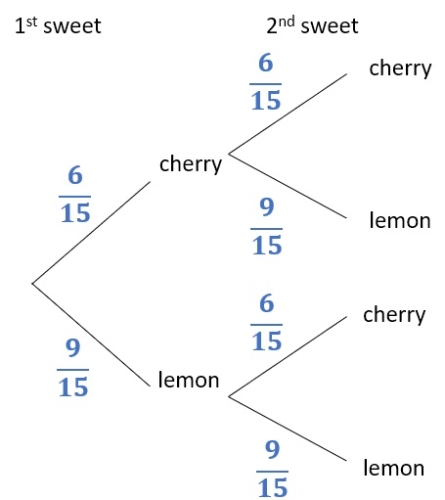
We can see that we could simplify some of the fractions, but generally we don't do that with tree diagrams as having the same denominator makes the calculations easier.
Ready to have a go at some questions?!
Grab your calculator and let's go!