


The following spinners are spun and the sum of the scores they landed on is recorded.
Do we know how to calculate how many possible outcomes are there?
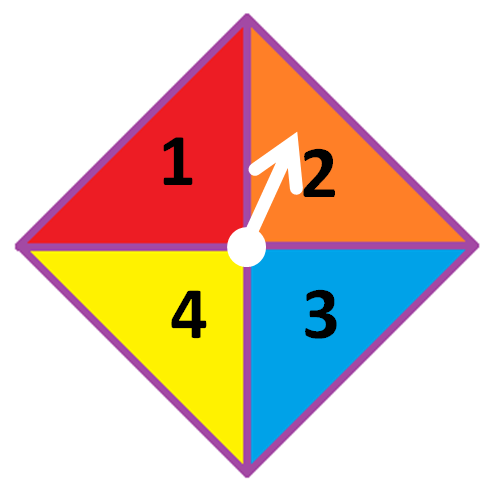
Well, each spinner has 4 possible outcomes.
So altogether, there are 4 x 4 = 16 possible outcomes for the combined events (i.e. multiple events occurring at the same time).
The two scores are added together and so we can create a sample space diagram to show the possible totals:
| 1 | 2 | 3 | 4 | |
| 1 | 2 | 3 | 4 | 5 |
| 2 | 3 | 4 | 5 | 6 |
| 3 | 4 | 5 | 6 | 7 |
| 4 | 5 | 6 | 7 | 8 |
We can see that the possible sums are 2, 3, 4, 5, 6, 7 and 8.
These all have different frequencies though (the number of times they occur) so there still are 16 possible outcomes altogether!
The sum of 7 occurs 2 times out of 16 possible outcomes.
So the probability of getting a sum of 7 is P(7) = 2/16 = 1/8!
We call the set of all possible outcomes the sample space.
We can write it as a list or in a table - just like we did above!
Let's put this all into practice now!


