

Have you ever been a volunteer?

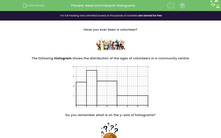
The following histogram shows the distribution of the ages of volunteers in a community centre:
Do you remember what is on the y-axis of histograms?

Histograms, unlike bar charts, have frequency density on the y-axis, calculated by:
Frequency density = frequency ÷ width of the interval
So if frequency density is on the y-axis, where is the frequency in a histogram?
To answer this, we can rearrange our formula for frequency density by multiplying by the width of the interval:
Frequency density = frequency ÷ width of the interval
Frequency density x width of the interval = frequency
So frequency is frequency density times the width of the interval!
Looking at our histogram again:
We can see that e.g. the class 20 ≤ a < 25 has a frequency density of 2.4.
Frequency is the frequency density times the width of the interval - what are these in terms of the rectangle representing 20 ≤ a < 25?
The frequency density is the height, and the width of the interval is the width of the rectangle.
Multiplying them together then gives us the area of the rectangle!
So: frequency in a histogram is the area of the bar (whereas in bar charts, it is the height)!
That means that 20 ≤ a < 25 has a frequency of 2.4 x 5 = 12, i.e. there were 12 volunteers between the ages of 20 and 25 years.
We can then find all the frequencies by multiplying the frequency density by the widths of the intervals:
| Age (years) | Frequency |
|---|---|
| 20 ≤ Age < 25 | 2.4 x 5 = 12 |
| 25 ≤ Age < 30 | 3.6 x 5 = 18 |
| 30 ≤ Age < 40 | 2.5 x 10 = 25 |
| 40 ≤ Age < 55 | 1 x 15 = 15 |
How could we then find an estimate of the median?
Well, there are 12 + 18 + 25 + 15 = 70 people altogether.
So the median is the value such that 35 people are on each side of it.
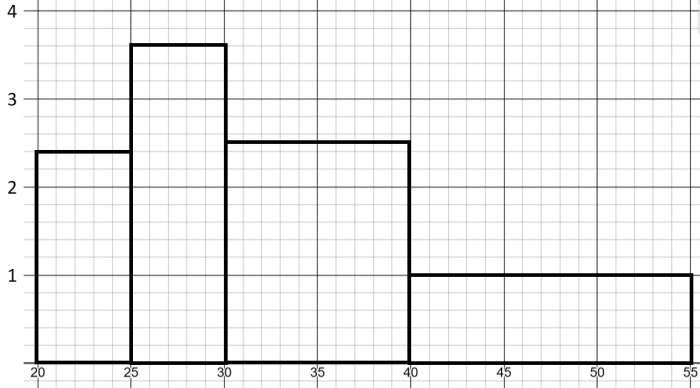
Looking at the histogram with the areas (i.e. frequencies) calculated:
We can see that the orange and the yellow bars represent 12 + 18 = 30 people.
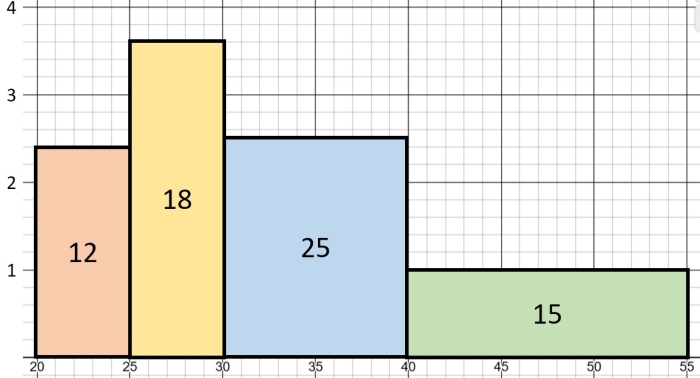
So to get to 35, we need to go further 5 'into' the blue rectangle.
The blue rectangle has the height (frequency density) of 2.5 so we need to go 2 units to the right to cover the area of 2 x 2.5 = 5:
2 units to the right of 30 is:
30 + 2 = 32
So the estimate of the median is 32!
It is an estimate because we don't know what the ages in the 30 ≤ Age < 40 class actually are (they could be e.g. all 39's so the median would actually be much higher!).
Ready to have a go at some questions? You can look back at this page at any point by clicking on the red help button on the screen.


