


How much time do you spend on homework?

In a survey conducted amongst Year 9 students, the number of hours spent on homework per week was recorded:
| Hours (h) | Frequency |
|---|---|
| 0 ≤ h < 2 | 5 |
| 2 ≤ h < 4 | 8 |
| 4 ≤ h < 6 | 10 |
| 6 ≤ h < 8 | 7 |
| 8 ≤ h < 10 | 3 |
How could we construct a cumulative frequency graph from this?

First things first - what is a cumulative frequency graph?!
It's a graph that (unsurprisingly!) shows us the cumulative frequency.
Let's remember that cumulative frequency is how many data points there are equal to or less than a certain value.
We find it by adding up ('accumulating') all the frequencies up to that point:
| Hours (h) | Frequency | Cumulative Frequency |
|---|---|---|
| 0 ≤ h < 2 | 5 | 5 |
| 2 ≤ h < 4 | 8 | 5 + 8 = 13 |
| 4 ≤ h < 6 | 10 | 13 + 10 = 23 |
| 6 ≤ h < 8 | 7 | 23 + 7 = 30 |
| 8 ≤ h < 10 | 3 | 30 + 3 = 33 |
To construct a cumulative frequency graph, we plot the cumulative frequency on the y-axis and use the upper end of each interval for the x-coordinates.
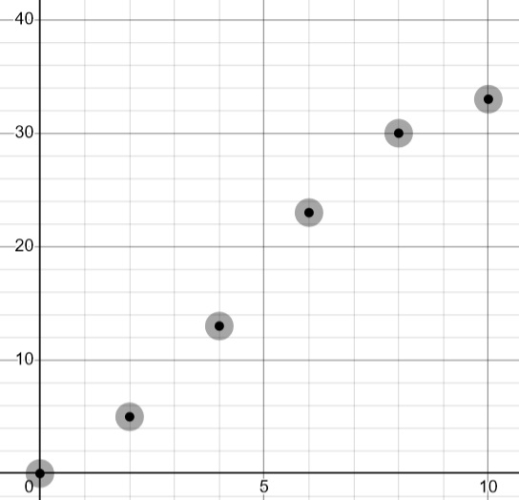
For example, the data above gives us the points:
(2, 5), (4, 13), (6, 23), (8, 30), (10, 33)
We always use the upper end of the interval since e.g. the cumulative frequency of 23 tells us that there are 23 students who study up to 6 hours, giving us the point (6, 23).
We first plot these points:
And then join them up with a lovely, continuous curve:
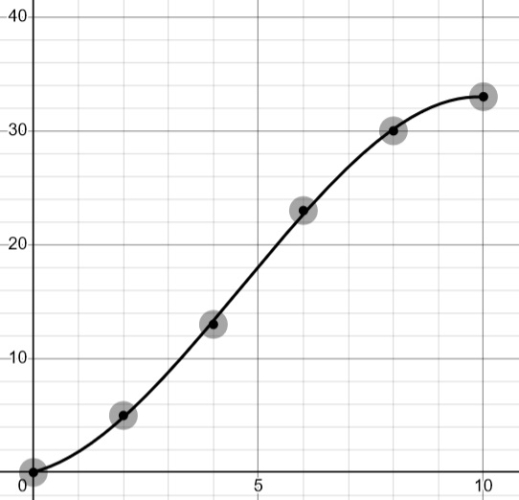
And that's it, we have our cumulative frequency graph!
Notice that there is the point (0,0) which we didn't have in our table.
(0,0) will always be the point we are starting at because 0 data points are up to 0!
Ready for some questions?!


