


What is cumulative frequency?

Cumulative frequency is how many data points there are equal to or less than a certain value.
We find it by adding up ('accumulating') all the frequencies up to that point.
So for example, we could have:
| Hours (h) | Frequency | Cumulative Frequency |
|---|---|---|
| 0 ≤ h < 2 | 5 | 5 |
| 2 ≤ h < 4 | 8 | 5 + 8 = 13 |
| 4 ≤ h < 6 | 10 | 13 + 10 = 23 |
| 6 ≤ h < 8 | 7 | 23 + 7 = 30 |
| 8 ≤ h < 10 | 3 | 30 + 3 = 33 |
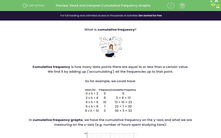
In cumulative frequency graphs, we have the cumulative frequency on the y-axis and what we are measuring on the x-axis (e.g. number of hours spent studying here):
We can use this graph to find estimates for cumulative frequencies and quartiles.
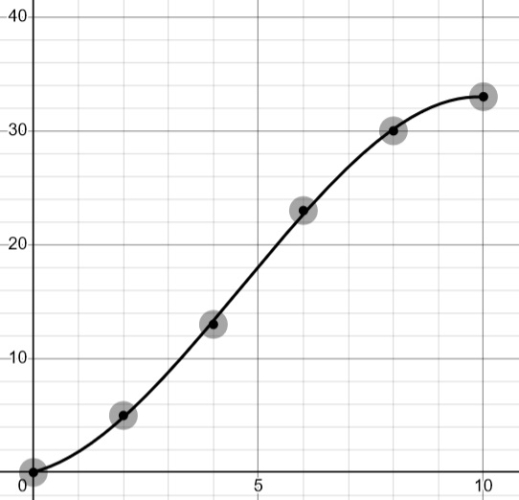
Let's say we wanted to find the estimate for how many students study up to 3 hours, i.e. the cumulative frequency for 3.
Then we just draw a line from 3 to the curve and then to the y-axis!
The cumulative frequency for 3 is approximately 9 - so there are 9 students who study up to 3 hours!
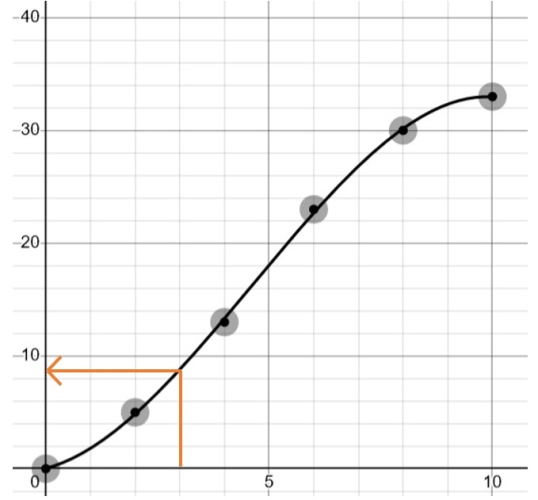
We can also find quartiles.
For example, we know that the lower quartile is the value such that a quarter (25%) of the data is below or equal to it.
Here, we can see that we have 33 data points in total (the y-coordinate of the last point).
A quarter of 33 is:
33 ÷ 4 = 8.25
So the lower quartile will be the value that corresponds to the cumulative frequency of 8.25:
That value seems to be just under 3 - so the estimate of the lower quartile is 2.8!
Ready for some questions?!


