

When you complete a cumulative frequency diagram in an exam, there are always two elements: the actual drawing of the cumulative frequency diagram and interpreting the graph.
What can we be expected to find from a cumulative frequency graph?
There are three things that you can find:
1) The median
2) The interquartile range
3) How many people are above/below a certain point
Let's look at these in an example.
Example:
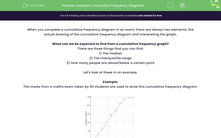
The marks from a maths exam taken by 50 students are used to draw this cumulative frequency diagram:
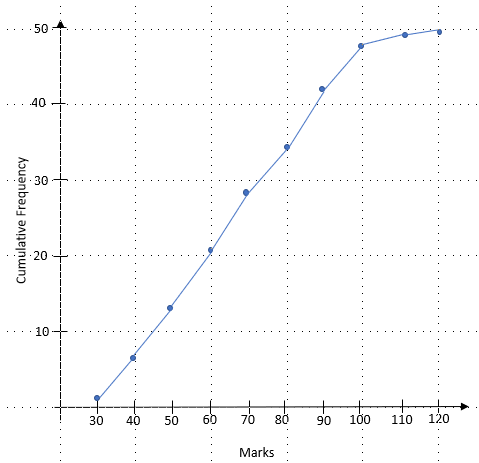
a) Find the median
The median is the middle piece of data. In this question, we have 50 pieces of data (this is just the highest point the CF goes to) so the median is at the 25th position.
To find this from the graph, we draw a line along from the cumulative frequency axis (always on the left) to our curve and then down to the marks.
We can now see that this hits the marks scale at 65.
The median is 65.
b) Find the interquartile range
The interquartile range is also known as the IQR.
It is found by subtracting the lower quartile (LQ) from the upper quartile(UQ).
So, we need to find the lower and upper quartiles.
We do this in a similar way to the median, but instead of doing the halfway point, we find the 1/4 and 3/4 points.
1/4 of 50 = 12.5
3/4 of 50 = 37.5
We now draw lines from 12.5 and 37.5 to find the LQ and UQ:

From this, we can see that the LQ = 49 and the UQ = 84.
This means that the IQR = 84 - 49 = 35 marks.
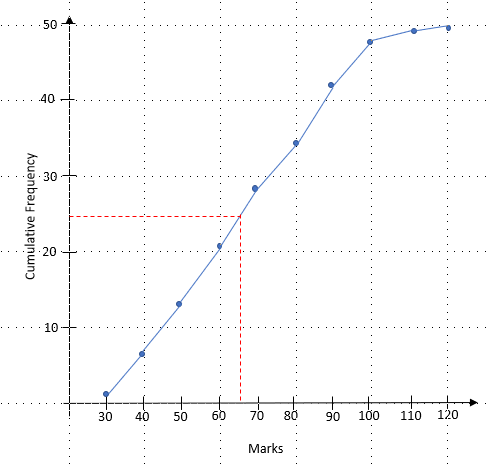
c) The pass mark for the test is 55 marks. How many students passed the test?
We know that the pass mark is 55, so we need to use our cumulative frequency graph the other way round.
If we draw a line up from 55 marks and across we get:
We can see that this line hits the cumulative frequency at 17. As we are looking for ones that passed, we need to know how many were above this line.
50 - 17 = 33
33 people passed the test.
Let's have a go at some questions now.


