

In a GCSE maths exam, once you have drawn a histogram, you will be expected to analyse it. Luckily, there are only a limited number of things they can ask you to do:
Find the total frequency.
Find the median and IQR.
Find the total number that are greater than, or less than, a specific amount.
Example:
Below is a histogram showing how late trains were in a month.
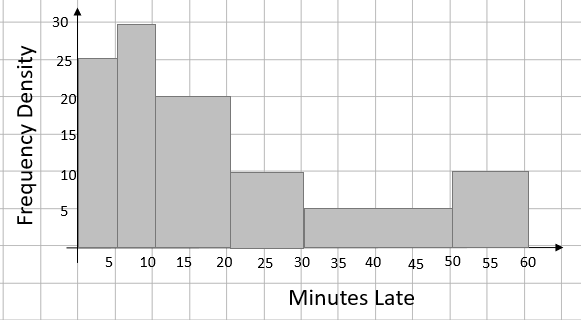
Find the total number of trains
All we have to do for this is to find the value of each rectangle in the histogram.
Remember that the frequency in a histogram is represented by the area of the rectangle.
To find the frequency, we need to use the formula: frequency = class width x frequency density
For the first rectangle, the class width is 5 and the frequency density is 25.
If we do the same for the other rectangles, we get the following frequencies:
5 x 25 = 125
5 x 30 = 150
10 x 20 = 200
10 x 10 = 100
20 x 5 = 100
10 x 10 = 100
These can be recorded in the frequency table below:
| Class | Frequency |
| 0 < x ≤ 5 | 125 |
| 5 < x ≤ 10 | 150 |
| 10 < x ≤ 20 | 200 |
| 20 < x ≤ 30 | 100 |
| 30 < x ≤ 50 | 100 |
| 50 < x ≤ 60 | 100 |
The total number of trains is therefore 775.
Estimate the median and interquartile range (IQR) for how late the trains were
We know that there are 775 trains in the survey. This means that the median would be at the 388th position, the lower quartile would be at the 194th number and the upper quartile at 582nd position.
Finding an estimate of the median (388th position):
We can count through the frequencies and find that the 388th position is in the group
10 < x ≤ 20.
The question is how far into this group?
The first two bars use 125 + 150 = 275 of the positions, so we need to go 113 (388 – 275) positions into this group.
As the group represents 200 trains, we need to go 113/200 into the group which is 10 wide.
If we calculate 113/200 x 10 we get 5.65
Adding this onto the start of the group gives 10 + 5.65
So the estimated median is 15.65 minutes.
If we repeat this process for the lower and upper quartiles, we get LQ = 7.3 and UQ of 31.4 minutes.
This gives an IQR of 31.4 – 7.3 = 24.1 minutes.
Find the percentage of trains that were more than 45 minutes late
If we draw a line showing the point that we are looking at, we get:
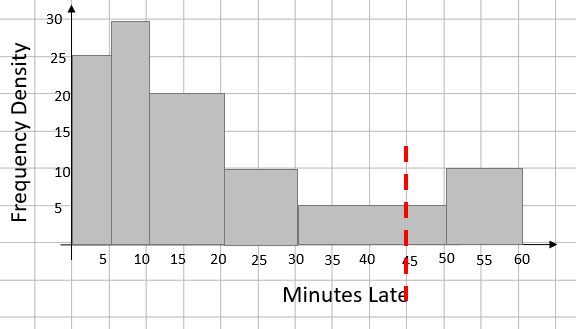
As we’re looking for the percentage that is greater than 45 minutes, we need to find the frequency represented by the bars to the right of the line.
The first one is ¼ of the group 30 < x ≤ 50 which will be 25 and the second group is all of the
group 50 < x ≤ 60 (100 trains), making a total of 125.
With our total of 125 / 775, this is 16.13% (to 2 decimal points)
That's a lot to remember, so let's move straight on to try out some questions.


